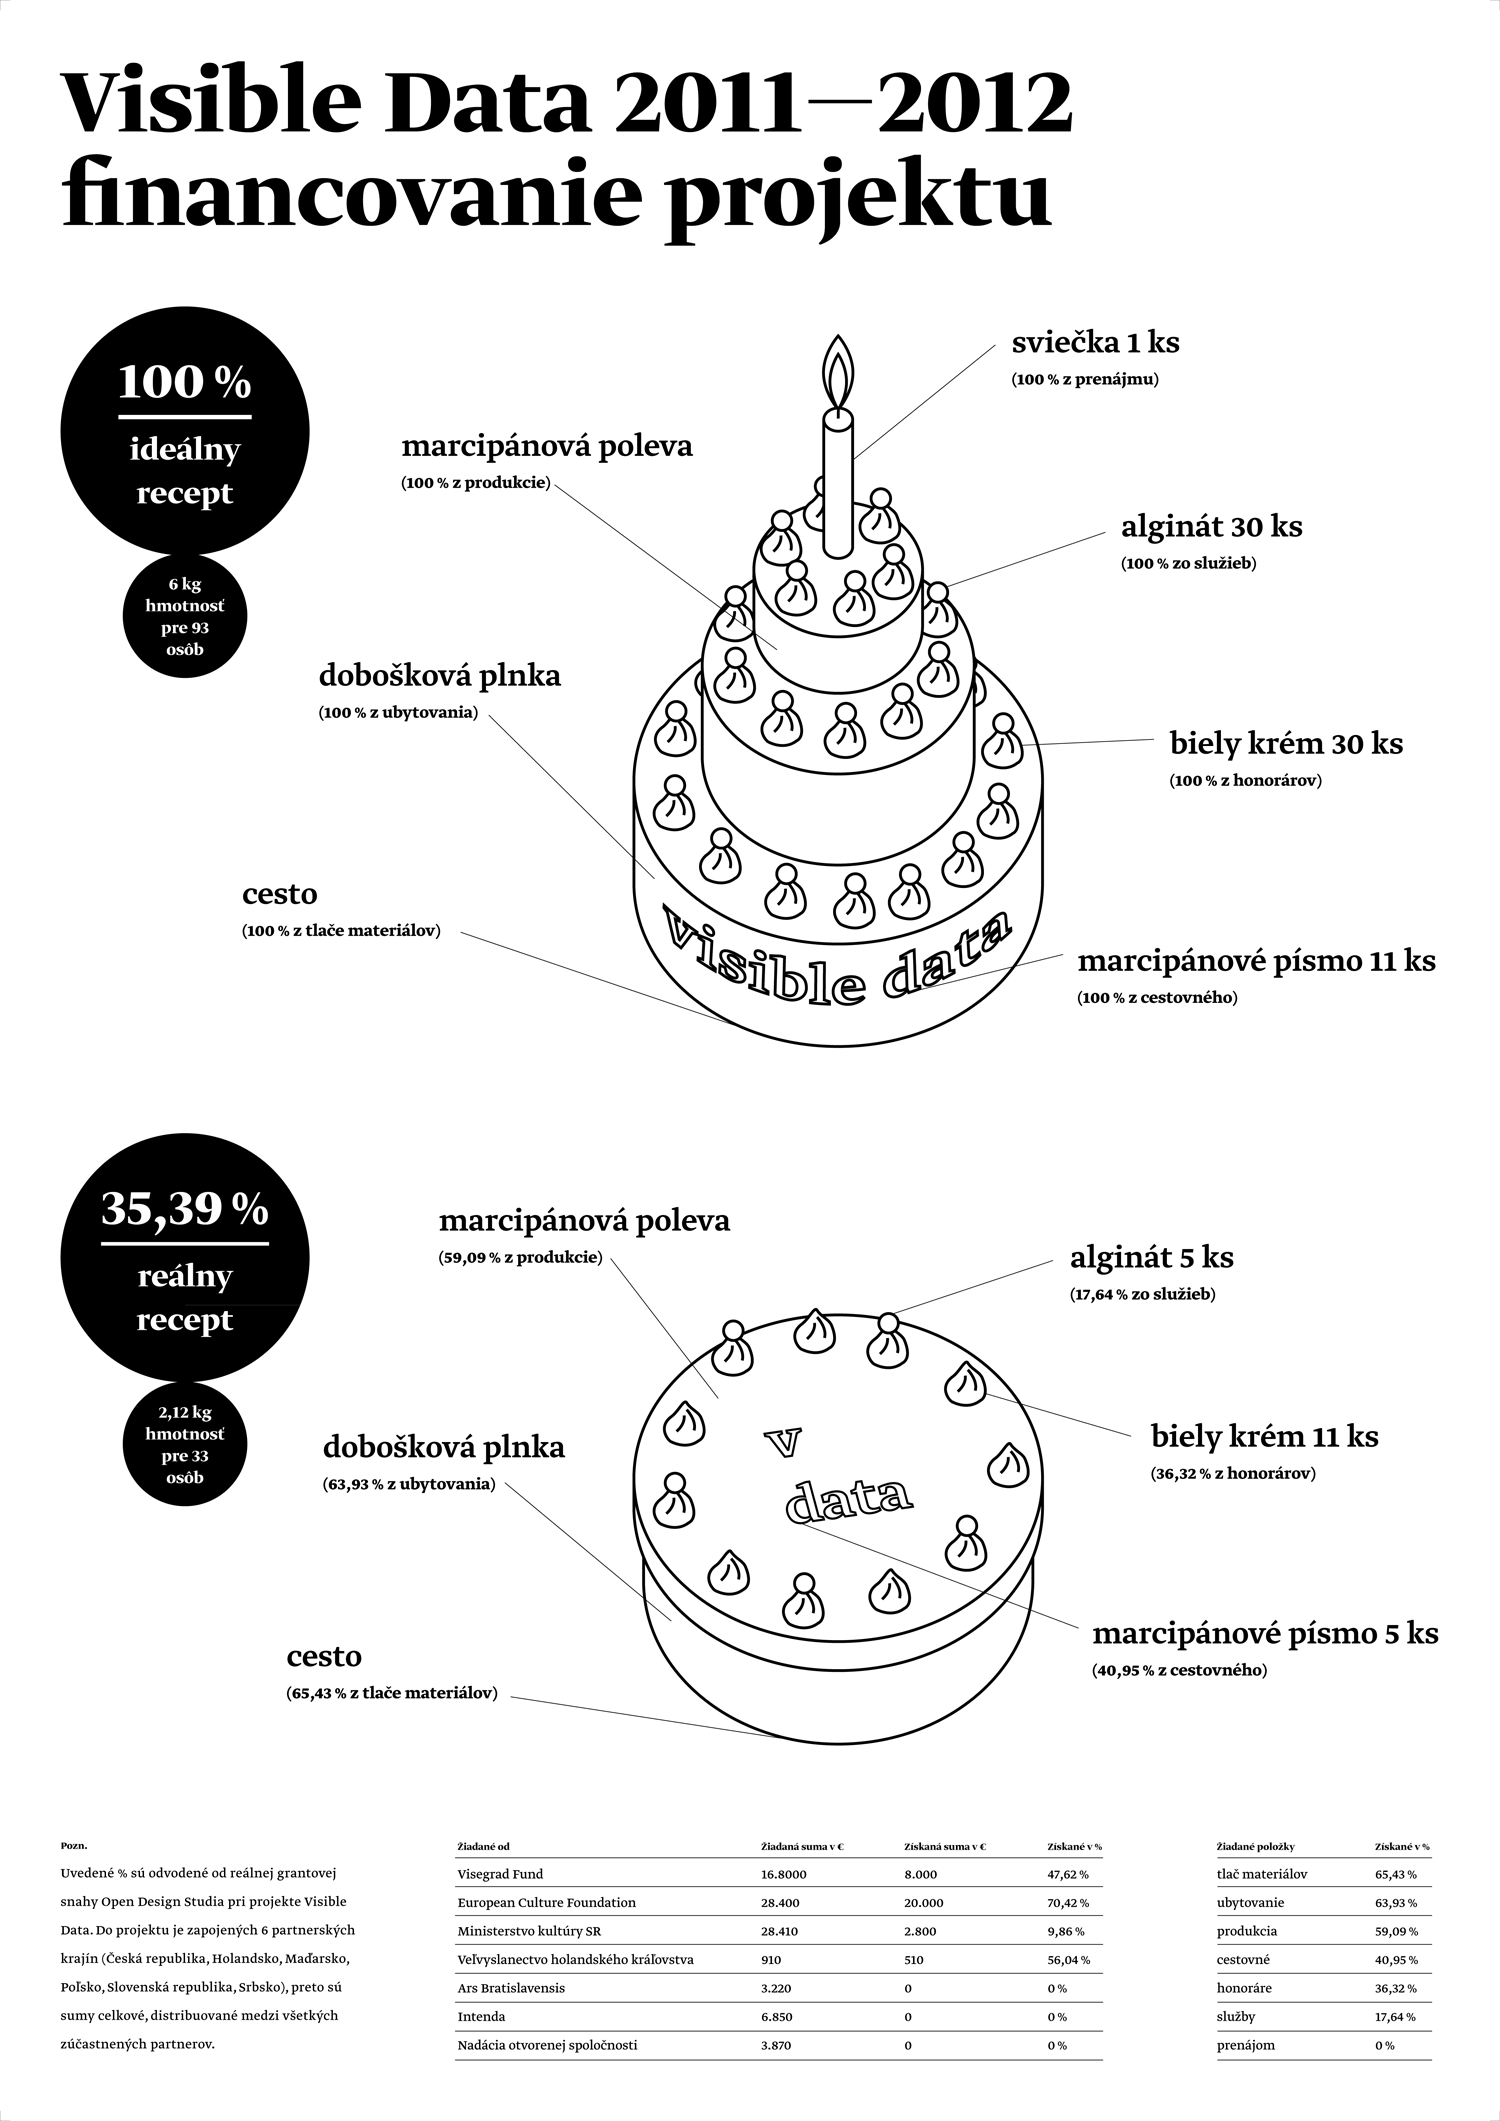
Ideal recepy
Martin Mistrík (SK)
Project Visible data_financing culture brings up together topics on visual communication, design, technology, new media and culture politics. By using efficient tools of information design and visualization language it makes budget for culture structures more visible.
Downloads
Visible Data 1/ 2010
Visible Data 2/2012
Visible Data 3/2012
|

|
|
|

|

|

|
|

|
|

|

|
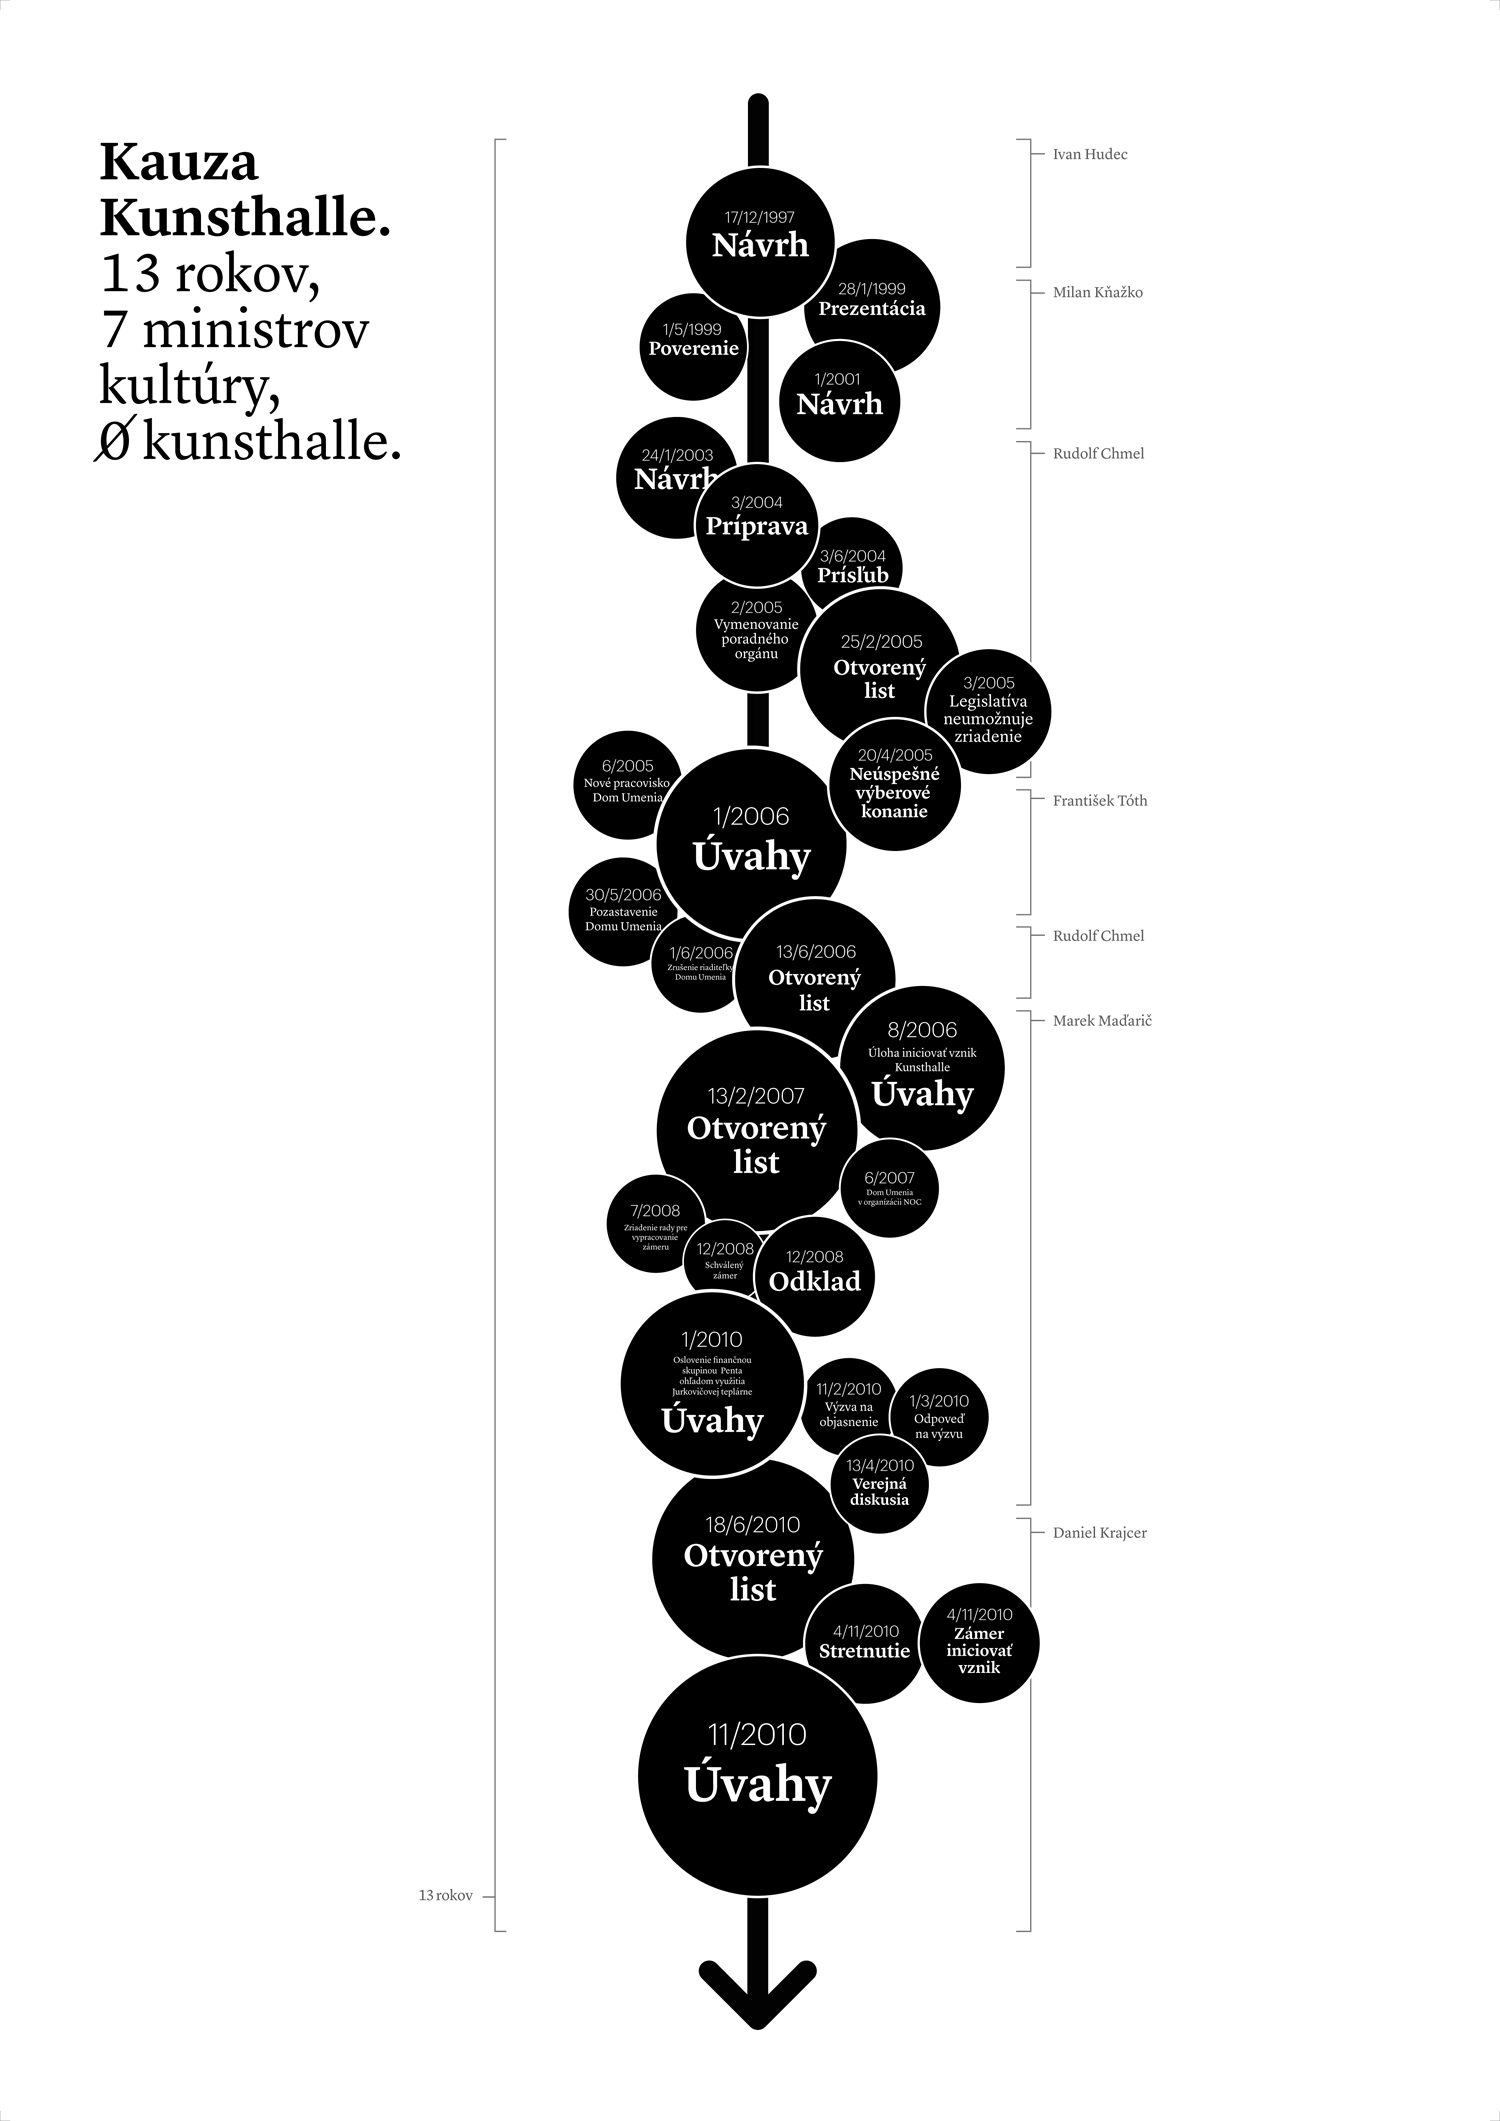
13+7=0 Simple visualization of the story behind ambitions to found first slovak Kunsthalle. The story starts with first thoughts and ends with the present situation taht did not change much. Infographic of bubbles in reversed timeline shows the importancy of thoughts and steps in this process.
|
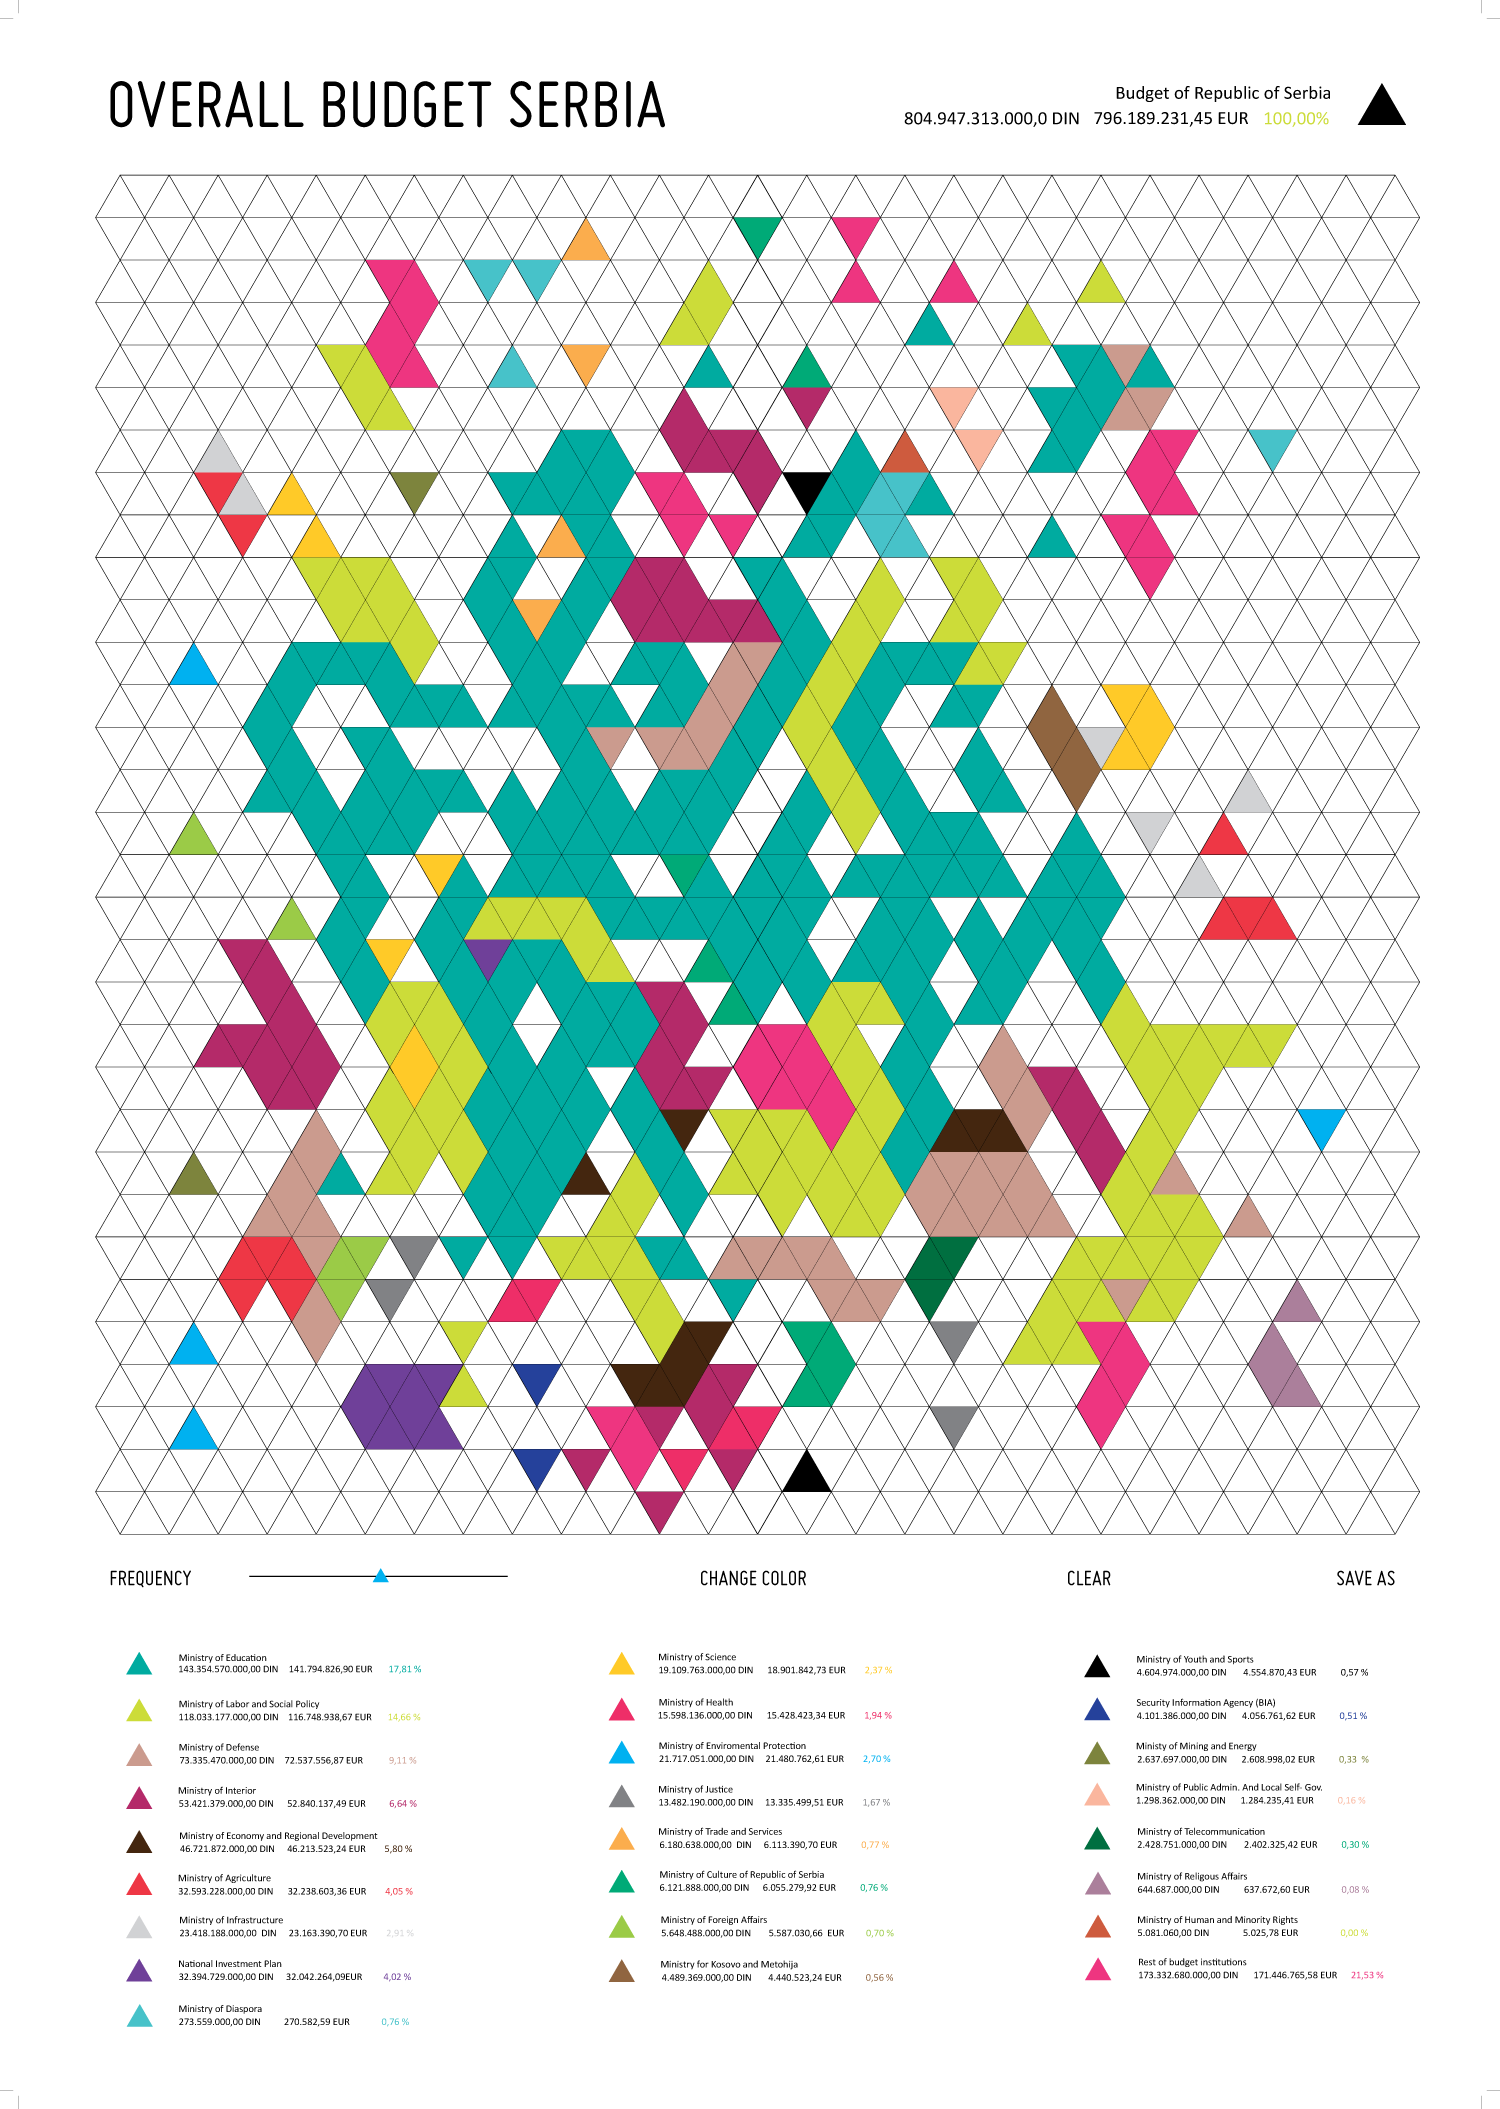
a*h/2 State Overall Budget of Republic of Serbia 2011 / This infographic is based on a grid consisting of many triangles. These triangles are randomly filled with colors. Every triangle has a color that corresponds with the color of a given budget category (which is placed under the grid). The number of triangles filled with the same color corresponds with the percentage of the given category. |
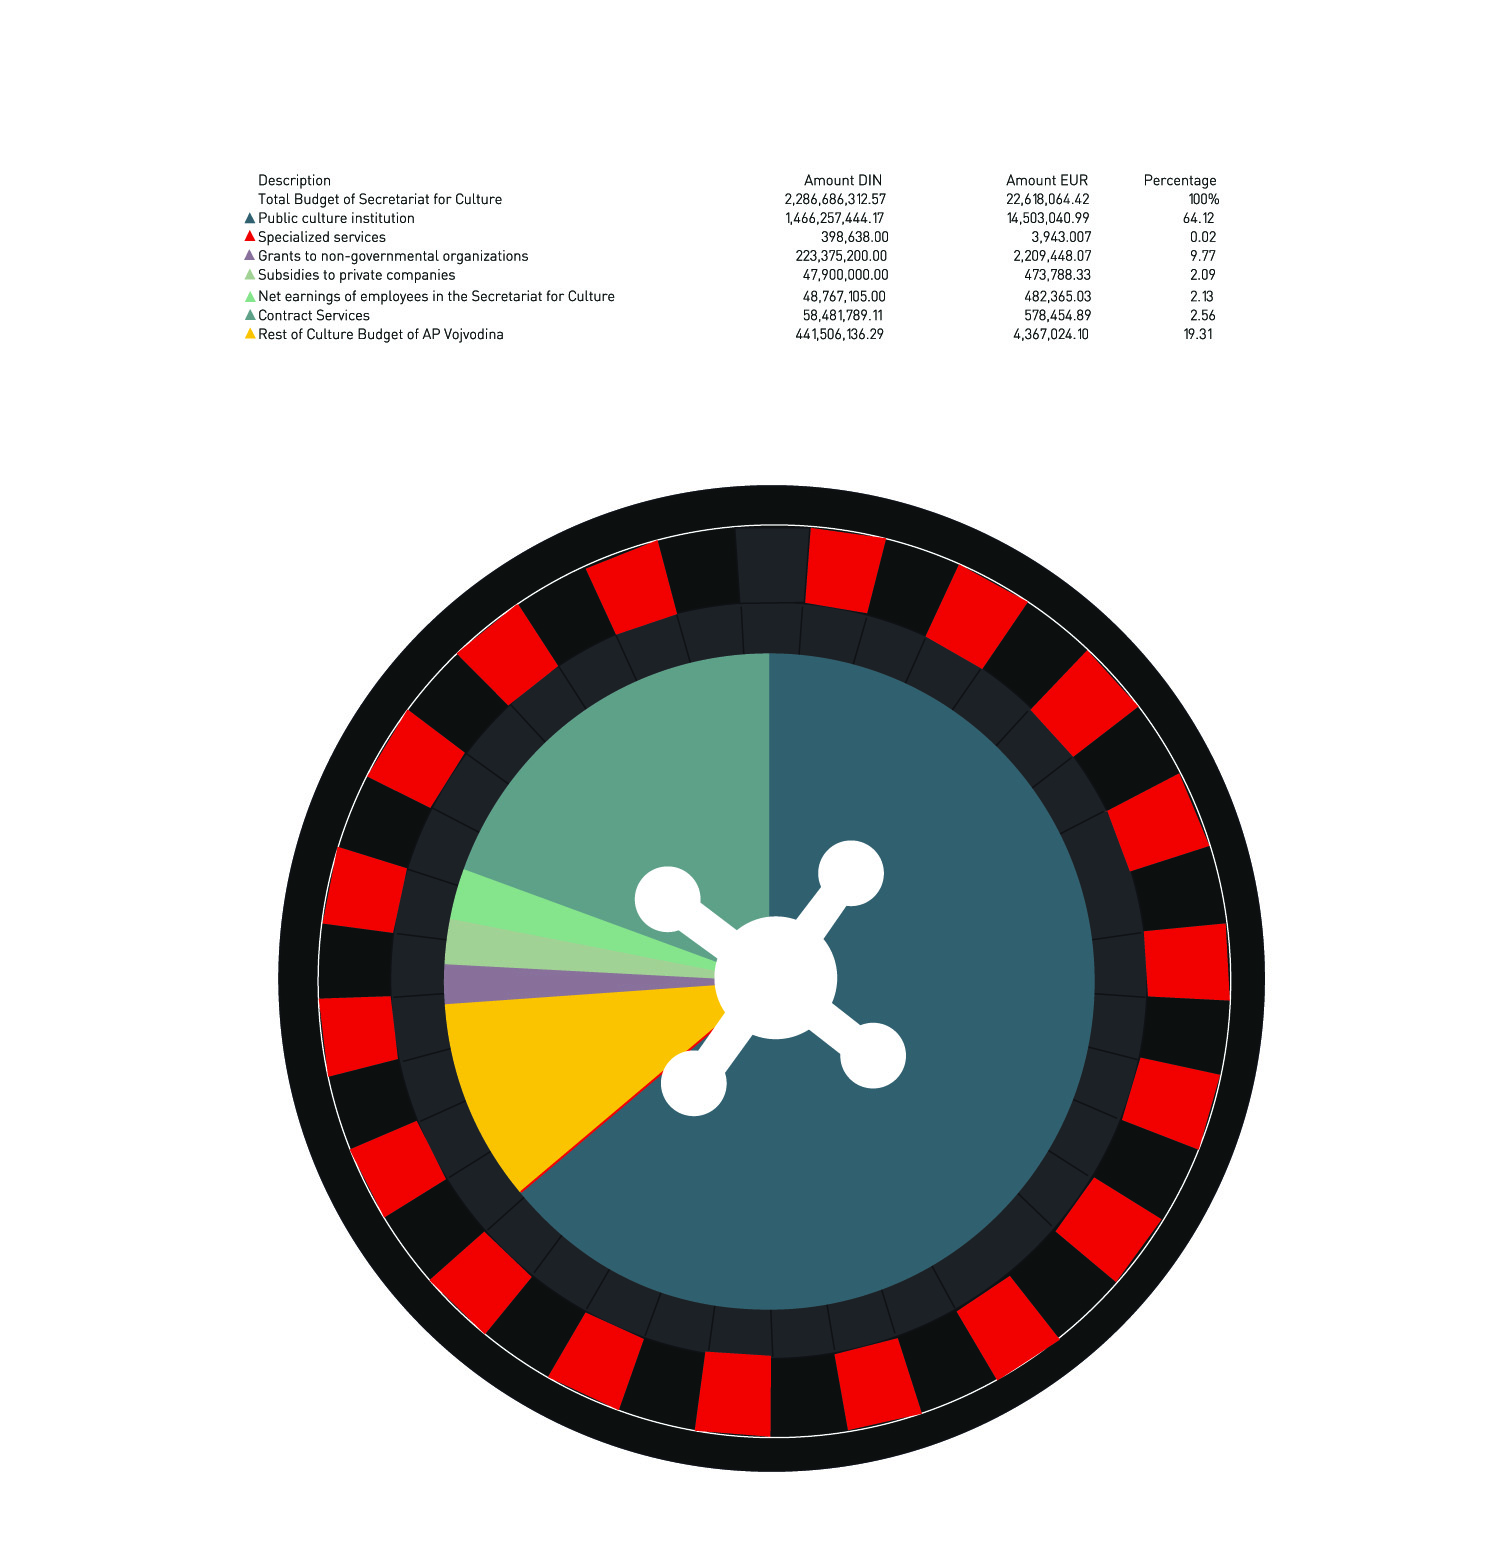
Roulette Regional Culture Budget of Vojvodina 2011 / Visualization represents a circle. Roulette as a casino game can be immediately recognized. The first form of roulette appeared in the 18th century in France. Just like in everyday life, money goes round. |
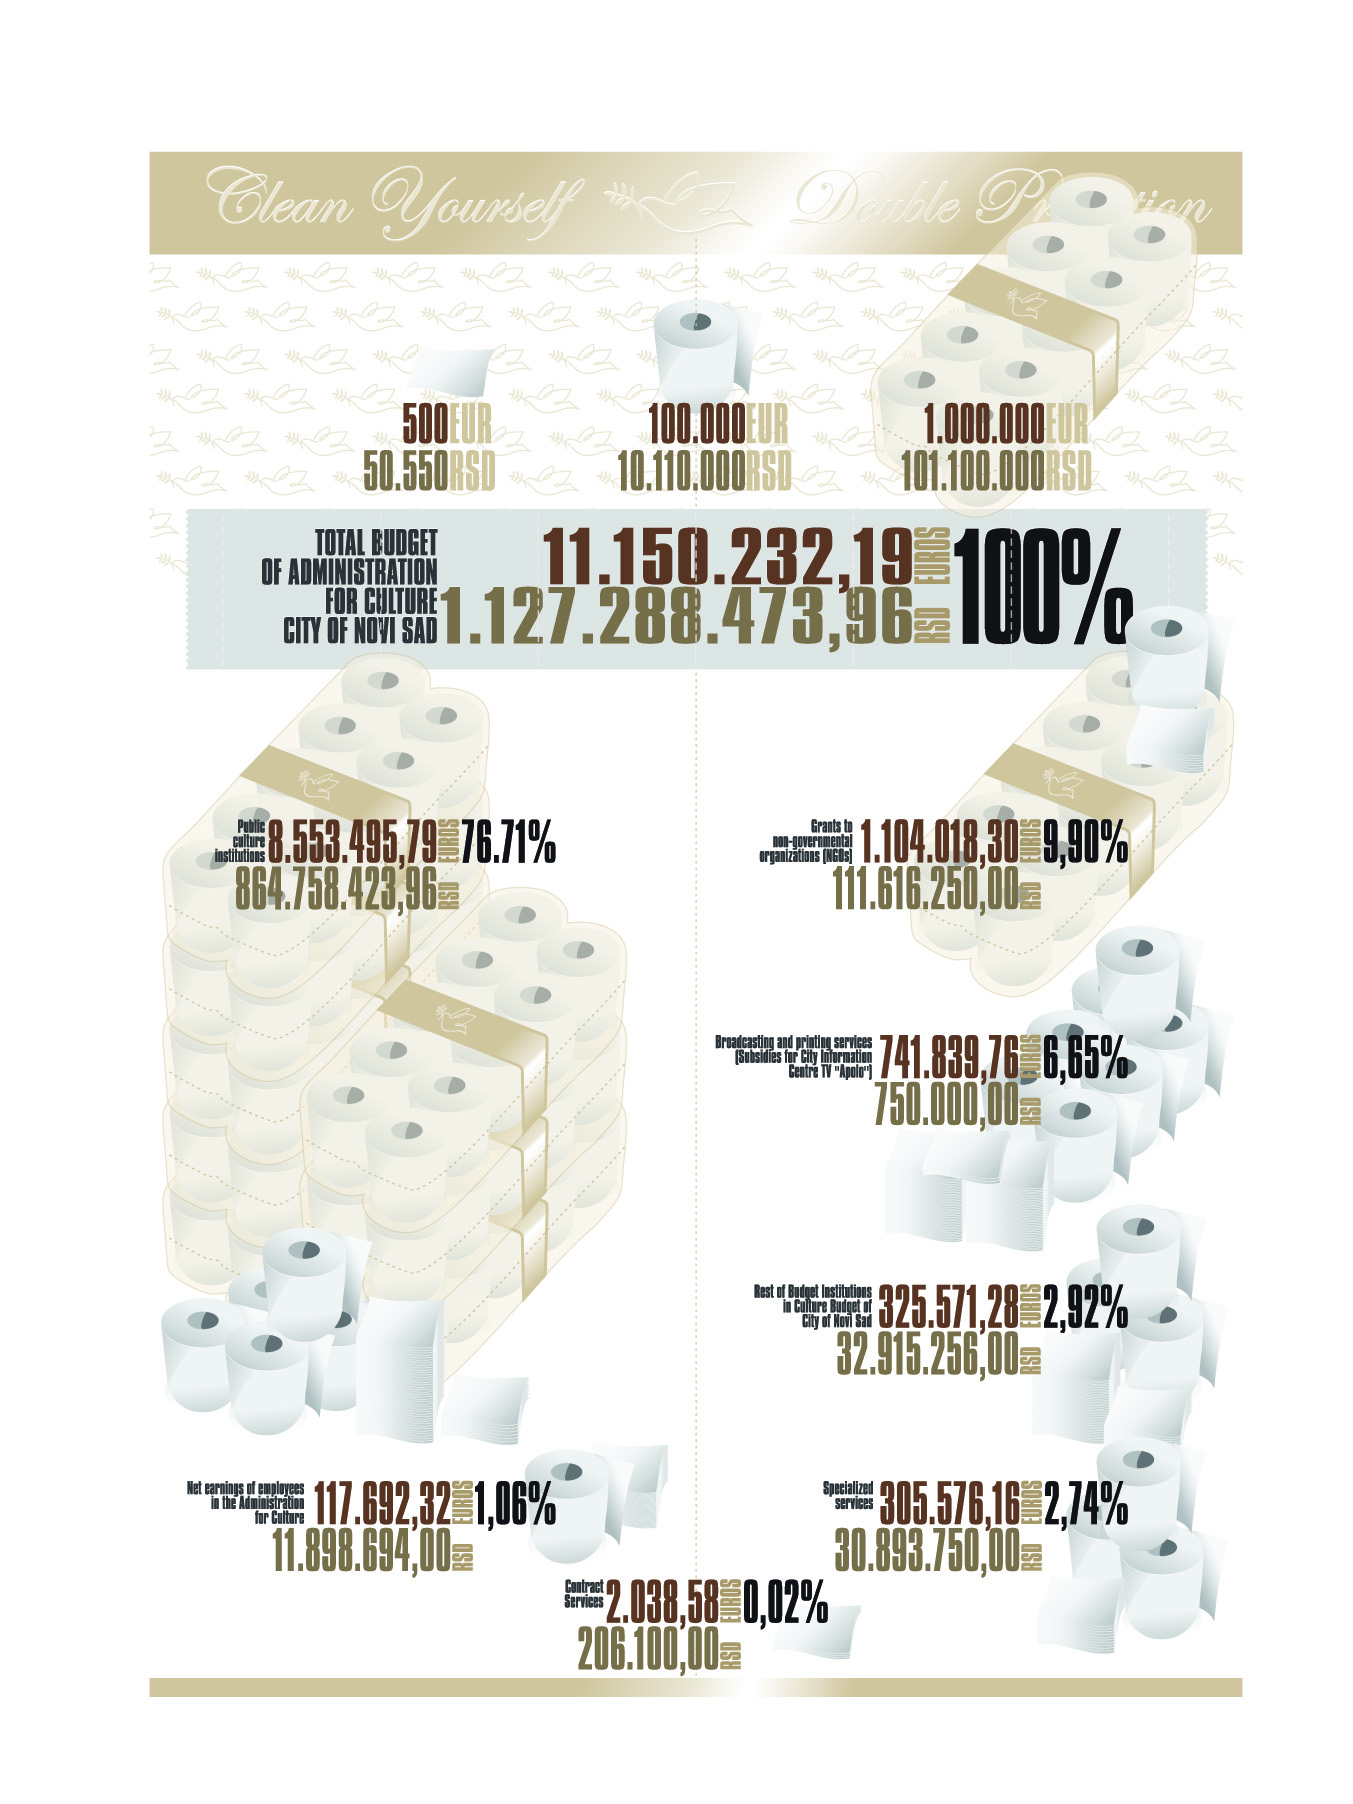
Clean hands Municipal Culture Budget of Novi Sad 2011 / This visualization represents projects/institutions/organizations/individuals who are granted funds from the City, and in this case, they are depicted as a toilet paper roll. At the same time, the toilet paper roll is a means of justifications, it is a panel in which unclean business can be erased and cleaned. Droppings are a result of cultural production. |
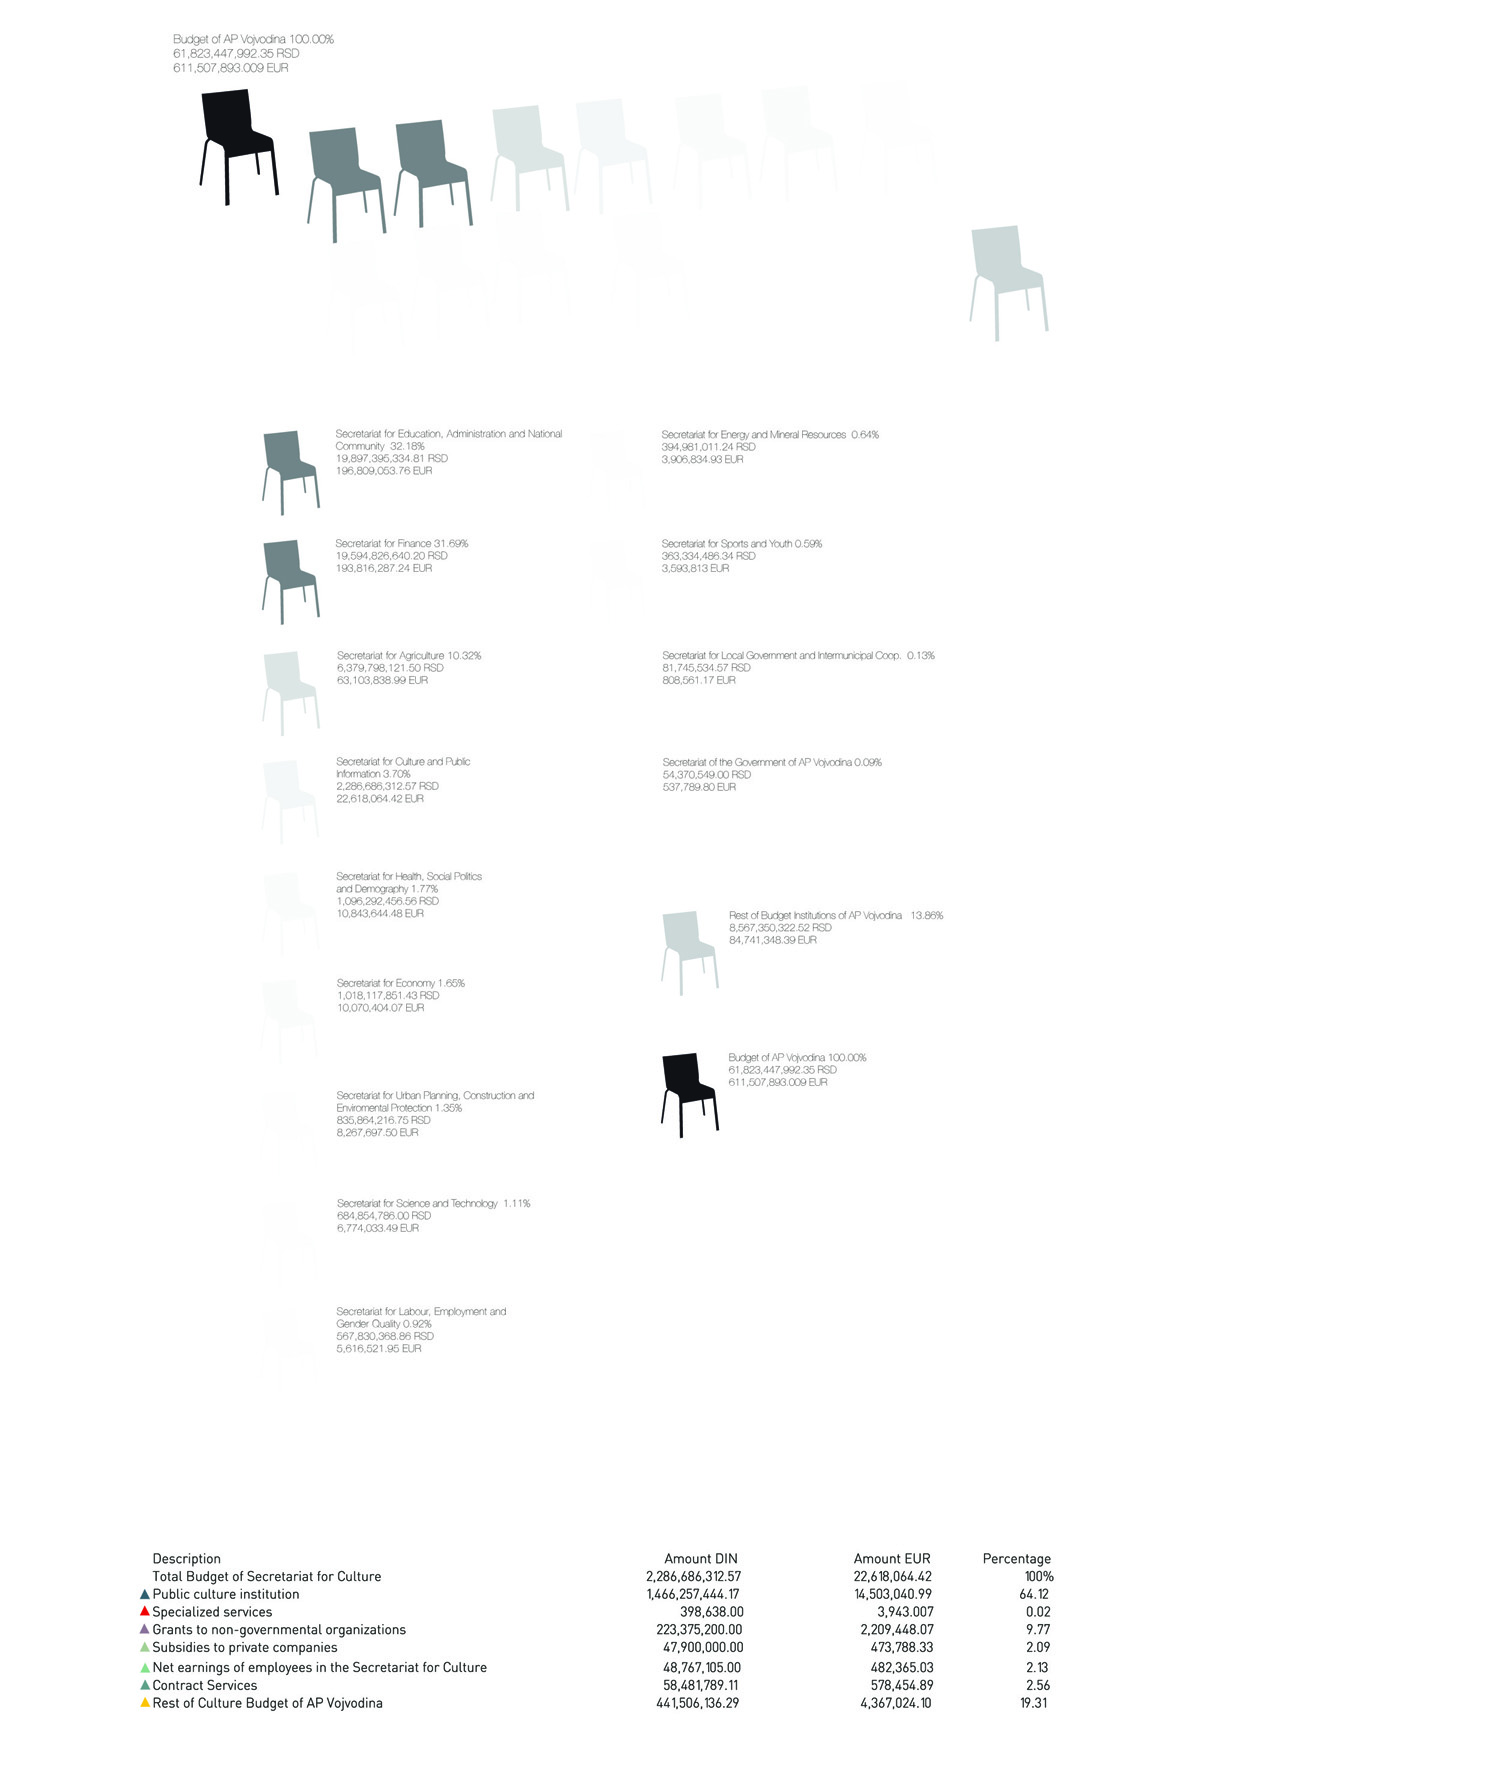
Regional Overall Budget of Vojvodina 2011 / The graph is visually represented by a group of chairs that are associated to managerial chairs and also a work place. Each chair visually represents one Ministry and the colours represent the exact percentage of the budget that each Ministry is granted from the state budget. The black coloured chair represents 100% of the whole budget and as the percentage decreases, the chairs are becoming grey. Thus the Ministries with the smallest budgets are represented by almost white chairs. Therefore, the chairs always have the same size, but their colours are changing depending on the amount of the budget. This kind of visualisation is also applicable to other budgets, for instance the budget for culture in the Republic of Serbia, Vojvodina, etc. |
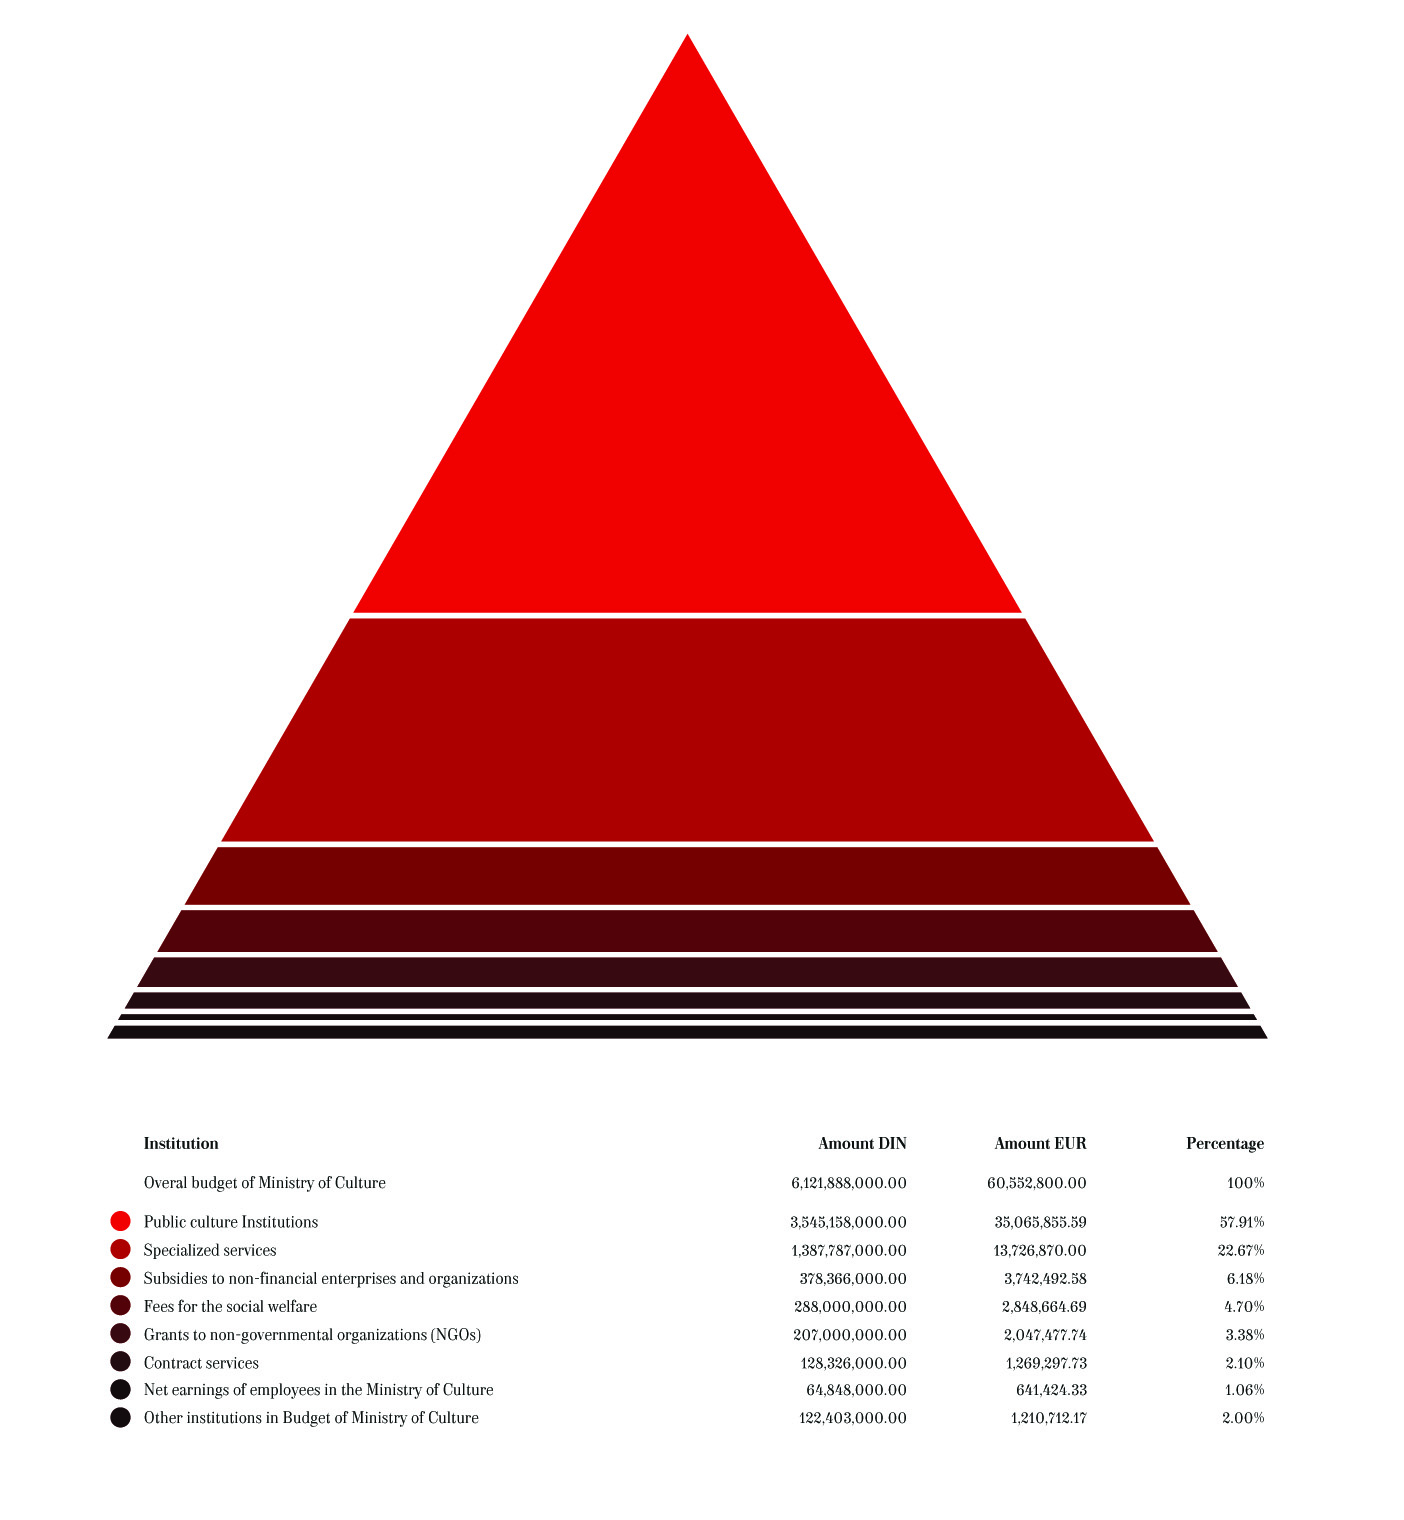
State Culture Budget of Serbia 2011 / “None are more hopelessly enslaved than those who falsely believe they are free.“ - Goethe |
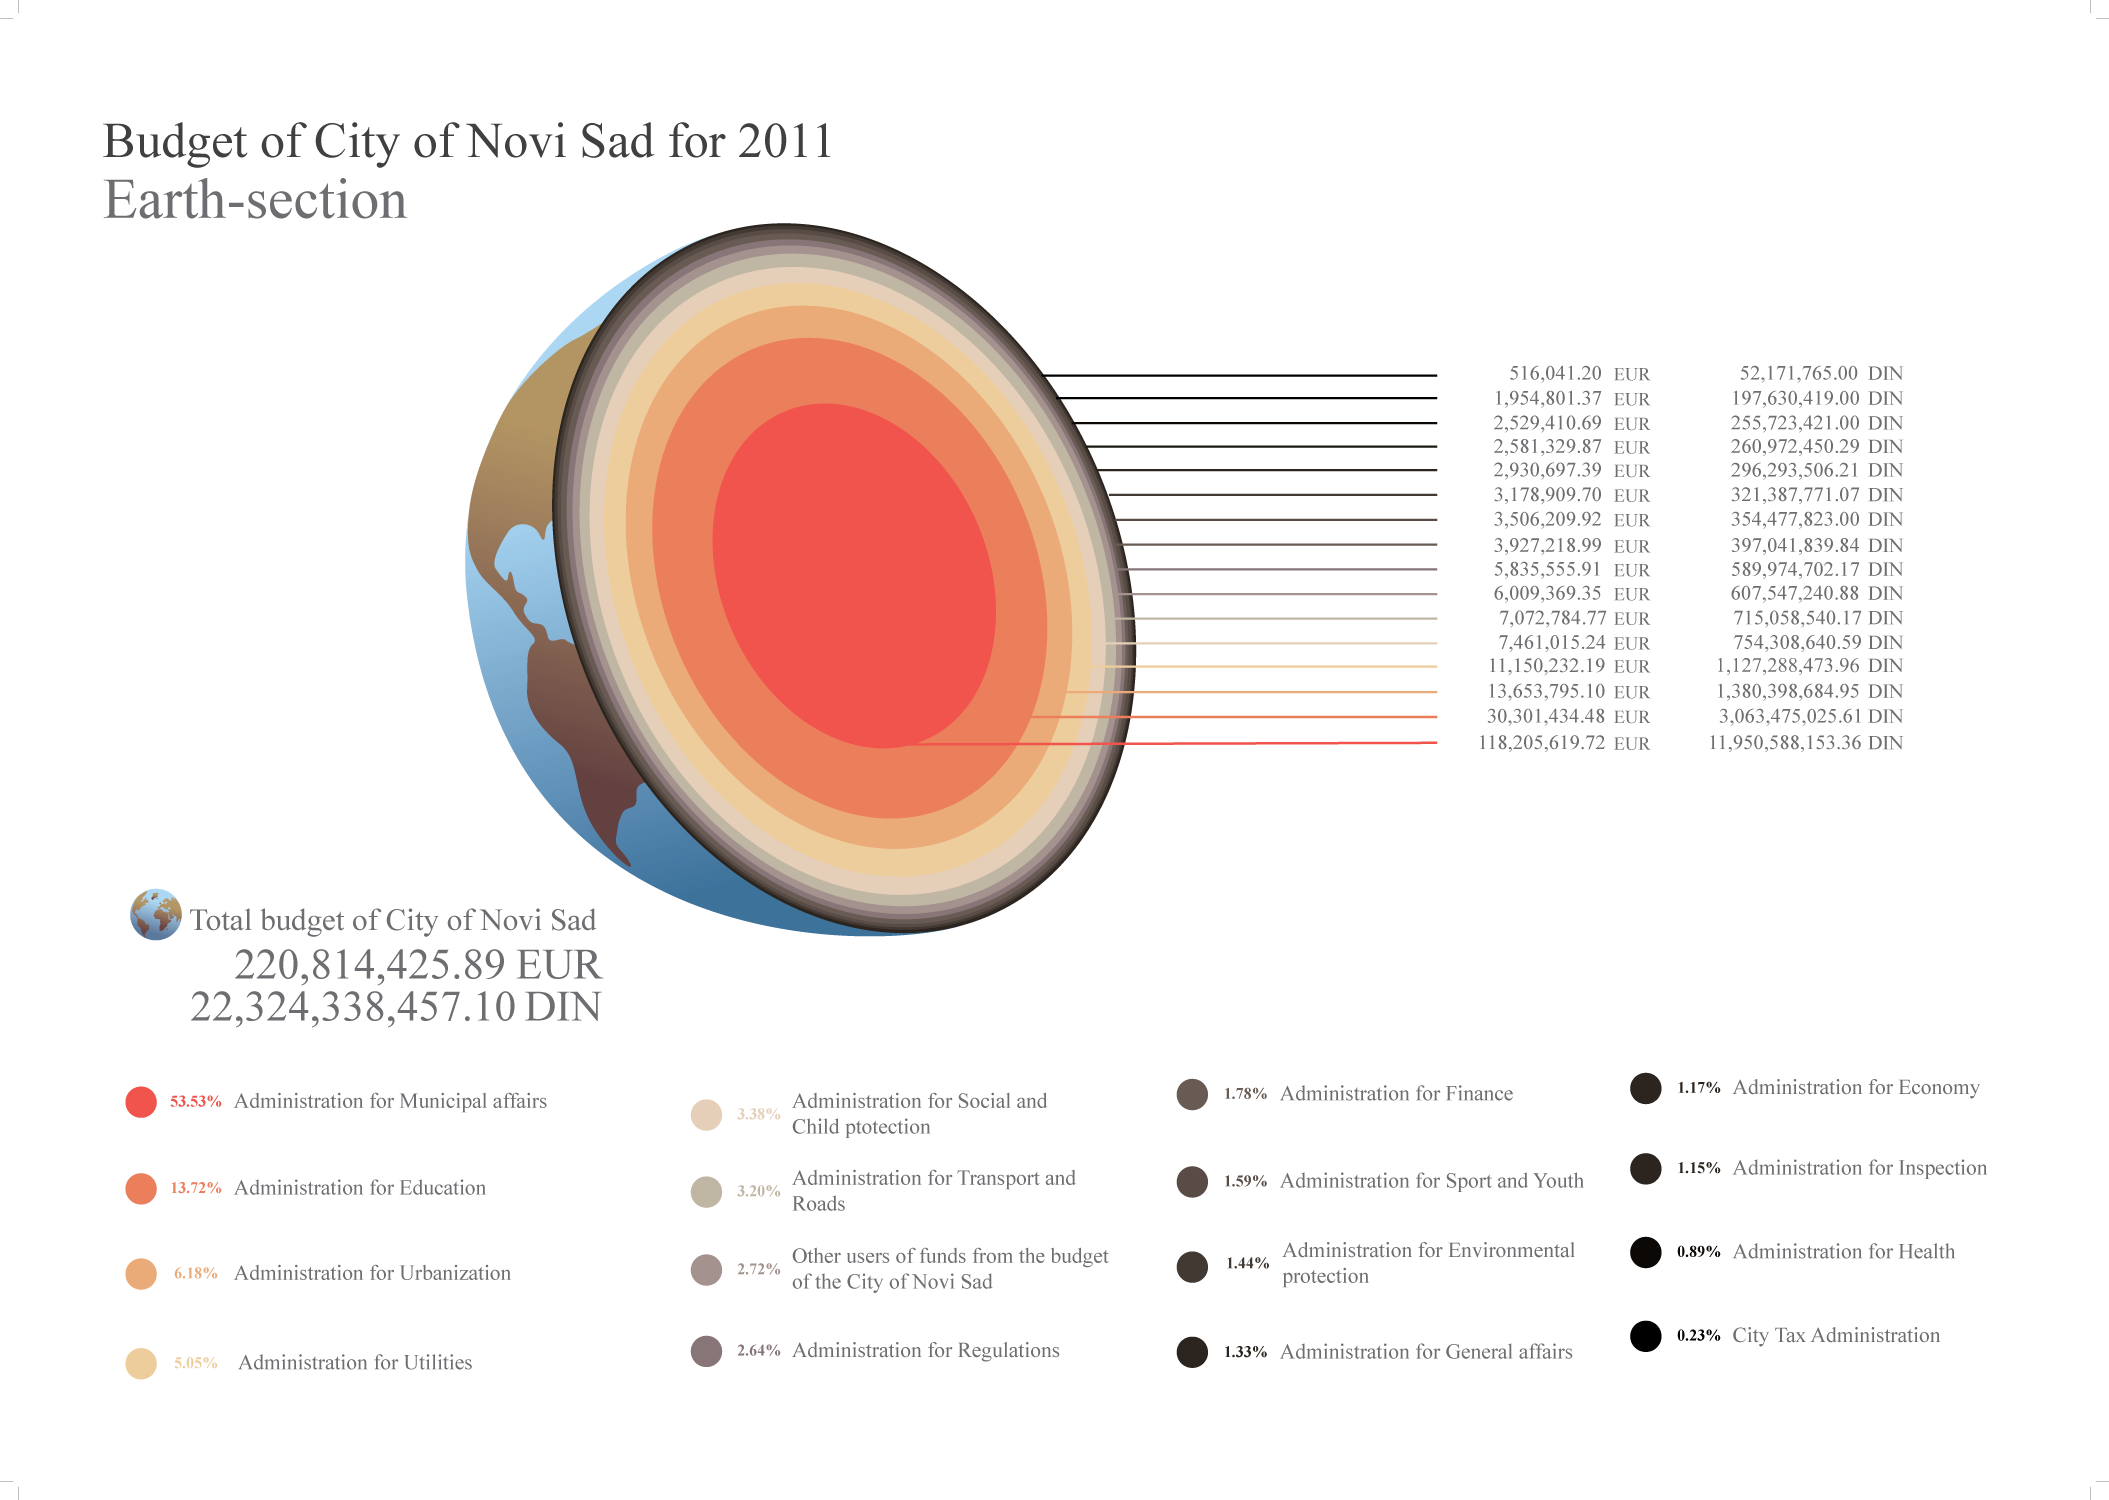
Municiapl Overall Budget of Novi Sad 2011 / This visualization represents the stratums/layers of budget, starting with a center-inner core which in this case occupies the largest part of the Earth-section across the outer core, thin stratums of the Earth’s mantle to a large number of stratums of the Earth’s crust. There should be a balance in capturing surface, if the inner core takes the bigger percentage of 65%, than it is possible to cause major changes on the surface, which would bring a changes in quality of life to all living things. |

Municipal Culture Budget of Amsterdam 2011 / This visualization shows the amount of money that flows to each of the projects by its transparency and size. The color is again chosen for its effect. The graphic is clear and easy to read, which is what I was after with this graphic. The text below makes it even more clear where the graphic starts and stops. This one was inspired by the classic way of making infographics. The downfall means that culture is dying as you can see in the graphic series. The graphic was programmed with Processing. |
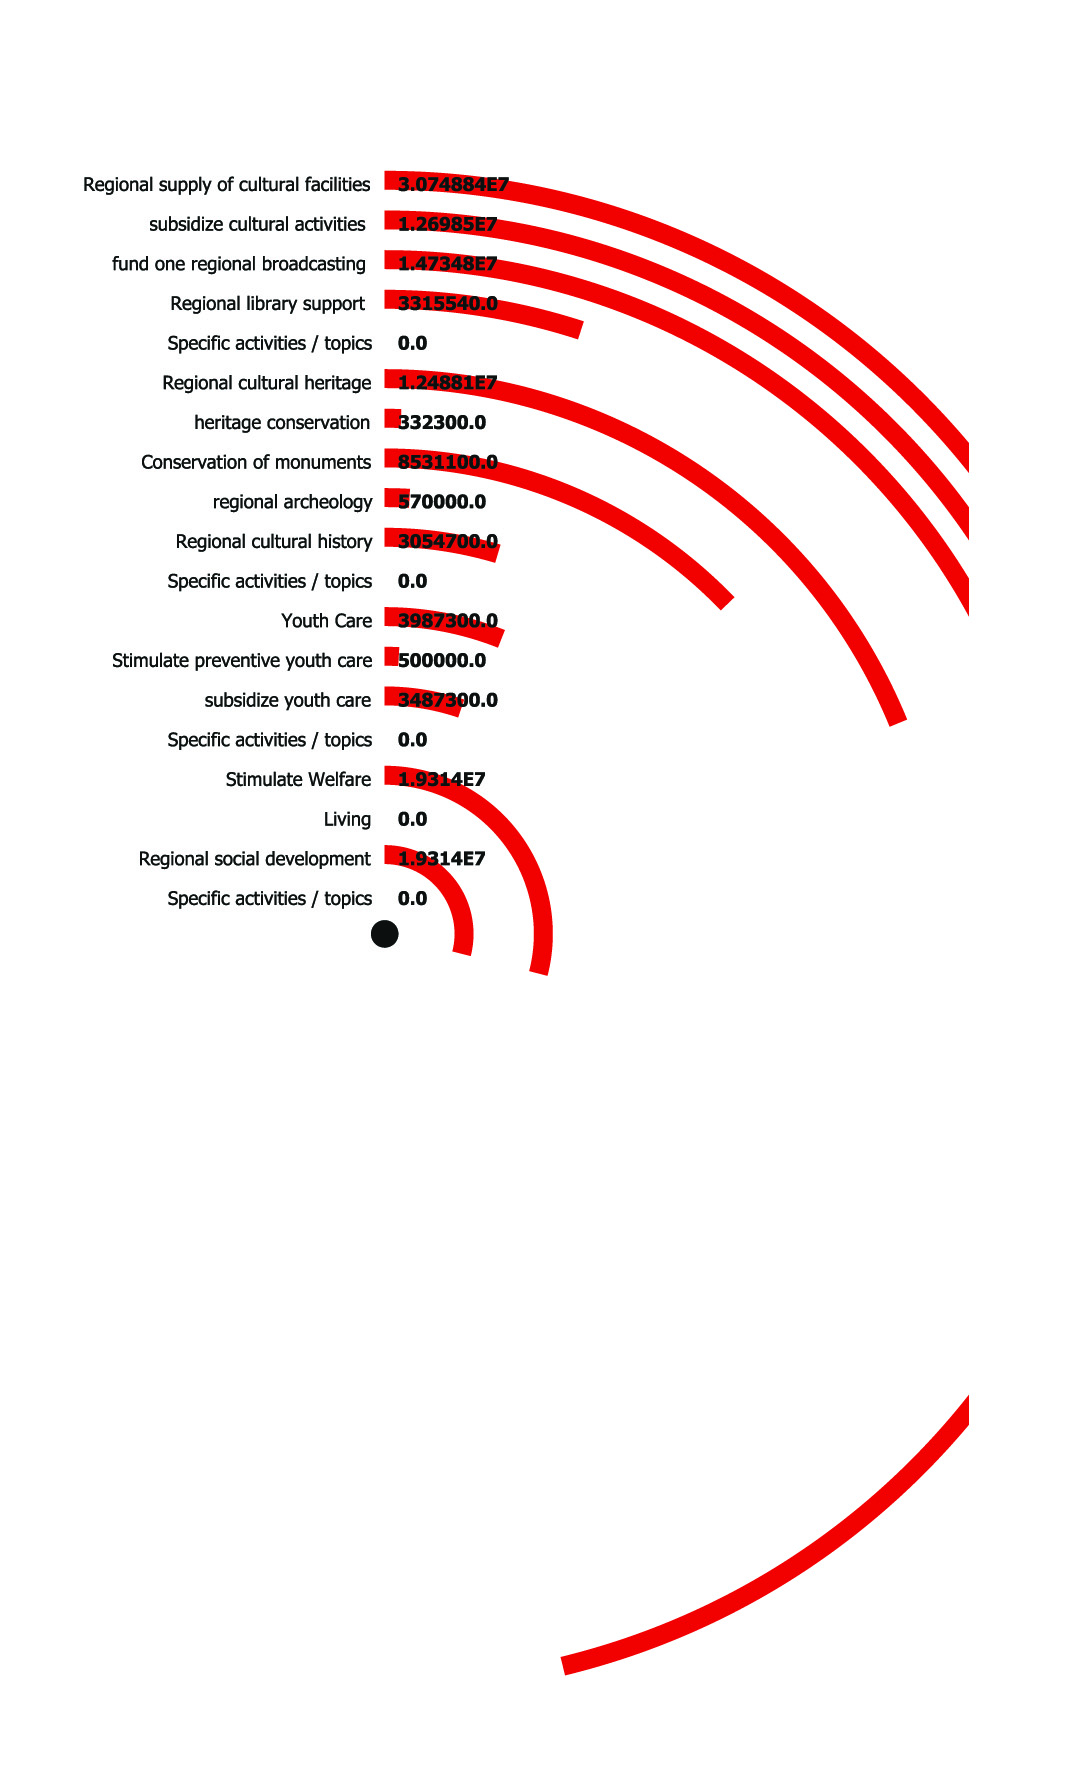
It's just a matter of time Regional Culture Budget of North-Holland 2011 / The arcs represent the amount of money that's going to each project. The design is a reference to the clock infographic screensaver. It's just a matter of time and, then, there is no culture any more. Since it is an important issue and I wanted to draw a lot of attention to it, I choose the color red. The graphic was programmed with Processing. |
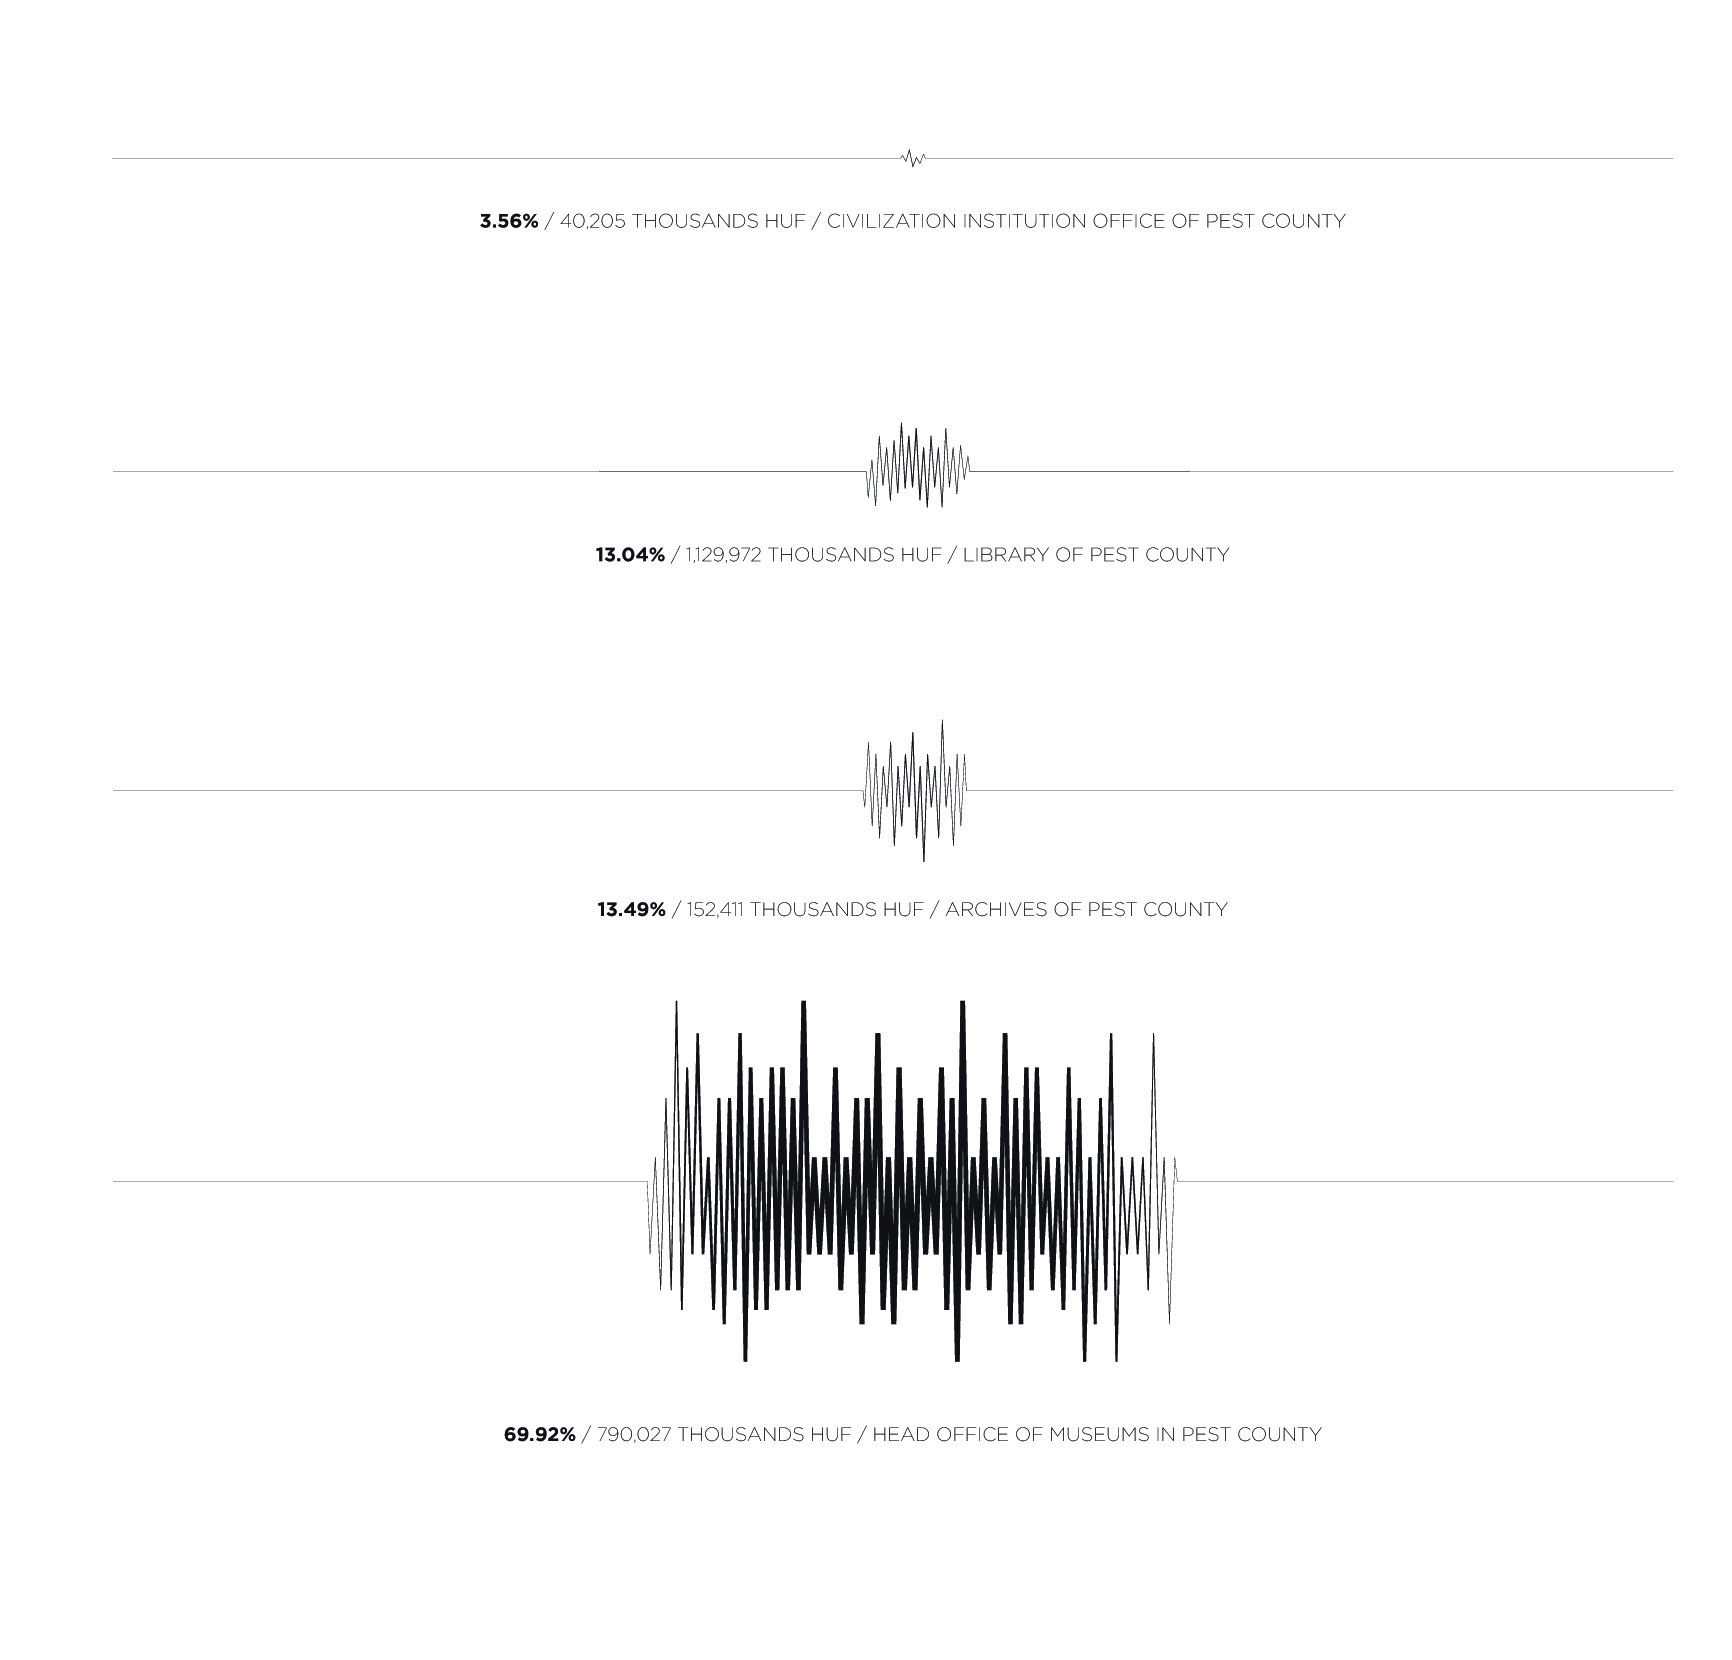
Sound graph Regional Culture Budget of Pest County 2011 / The visualization presents the structure of sound waves, each wave indicating an area or institution by its amplitude and weight. The less the wave is visible in weight and amplitude, the smaller amount of money the institution or area gets. |
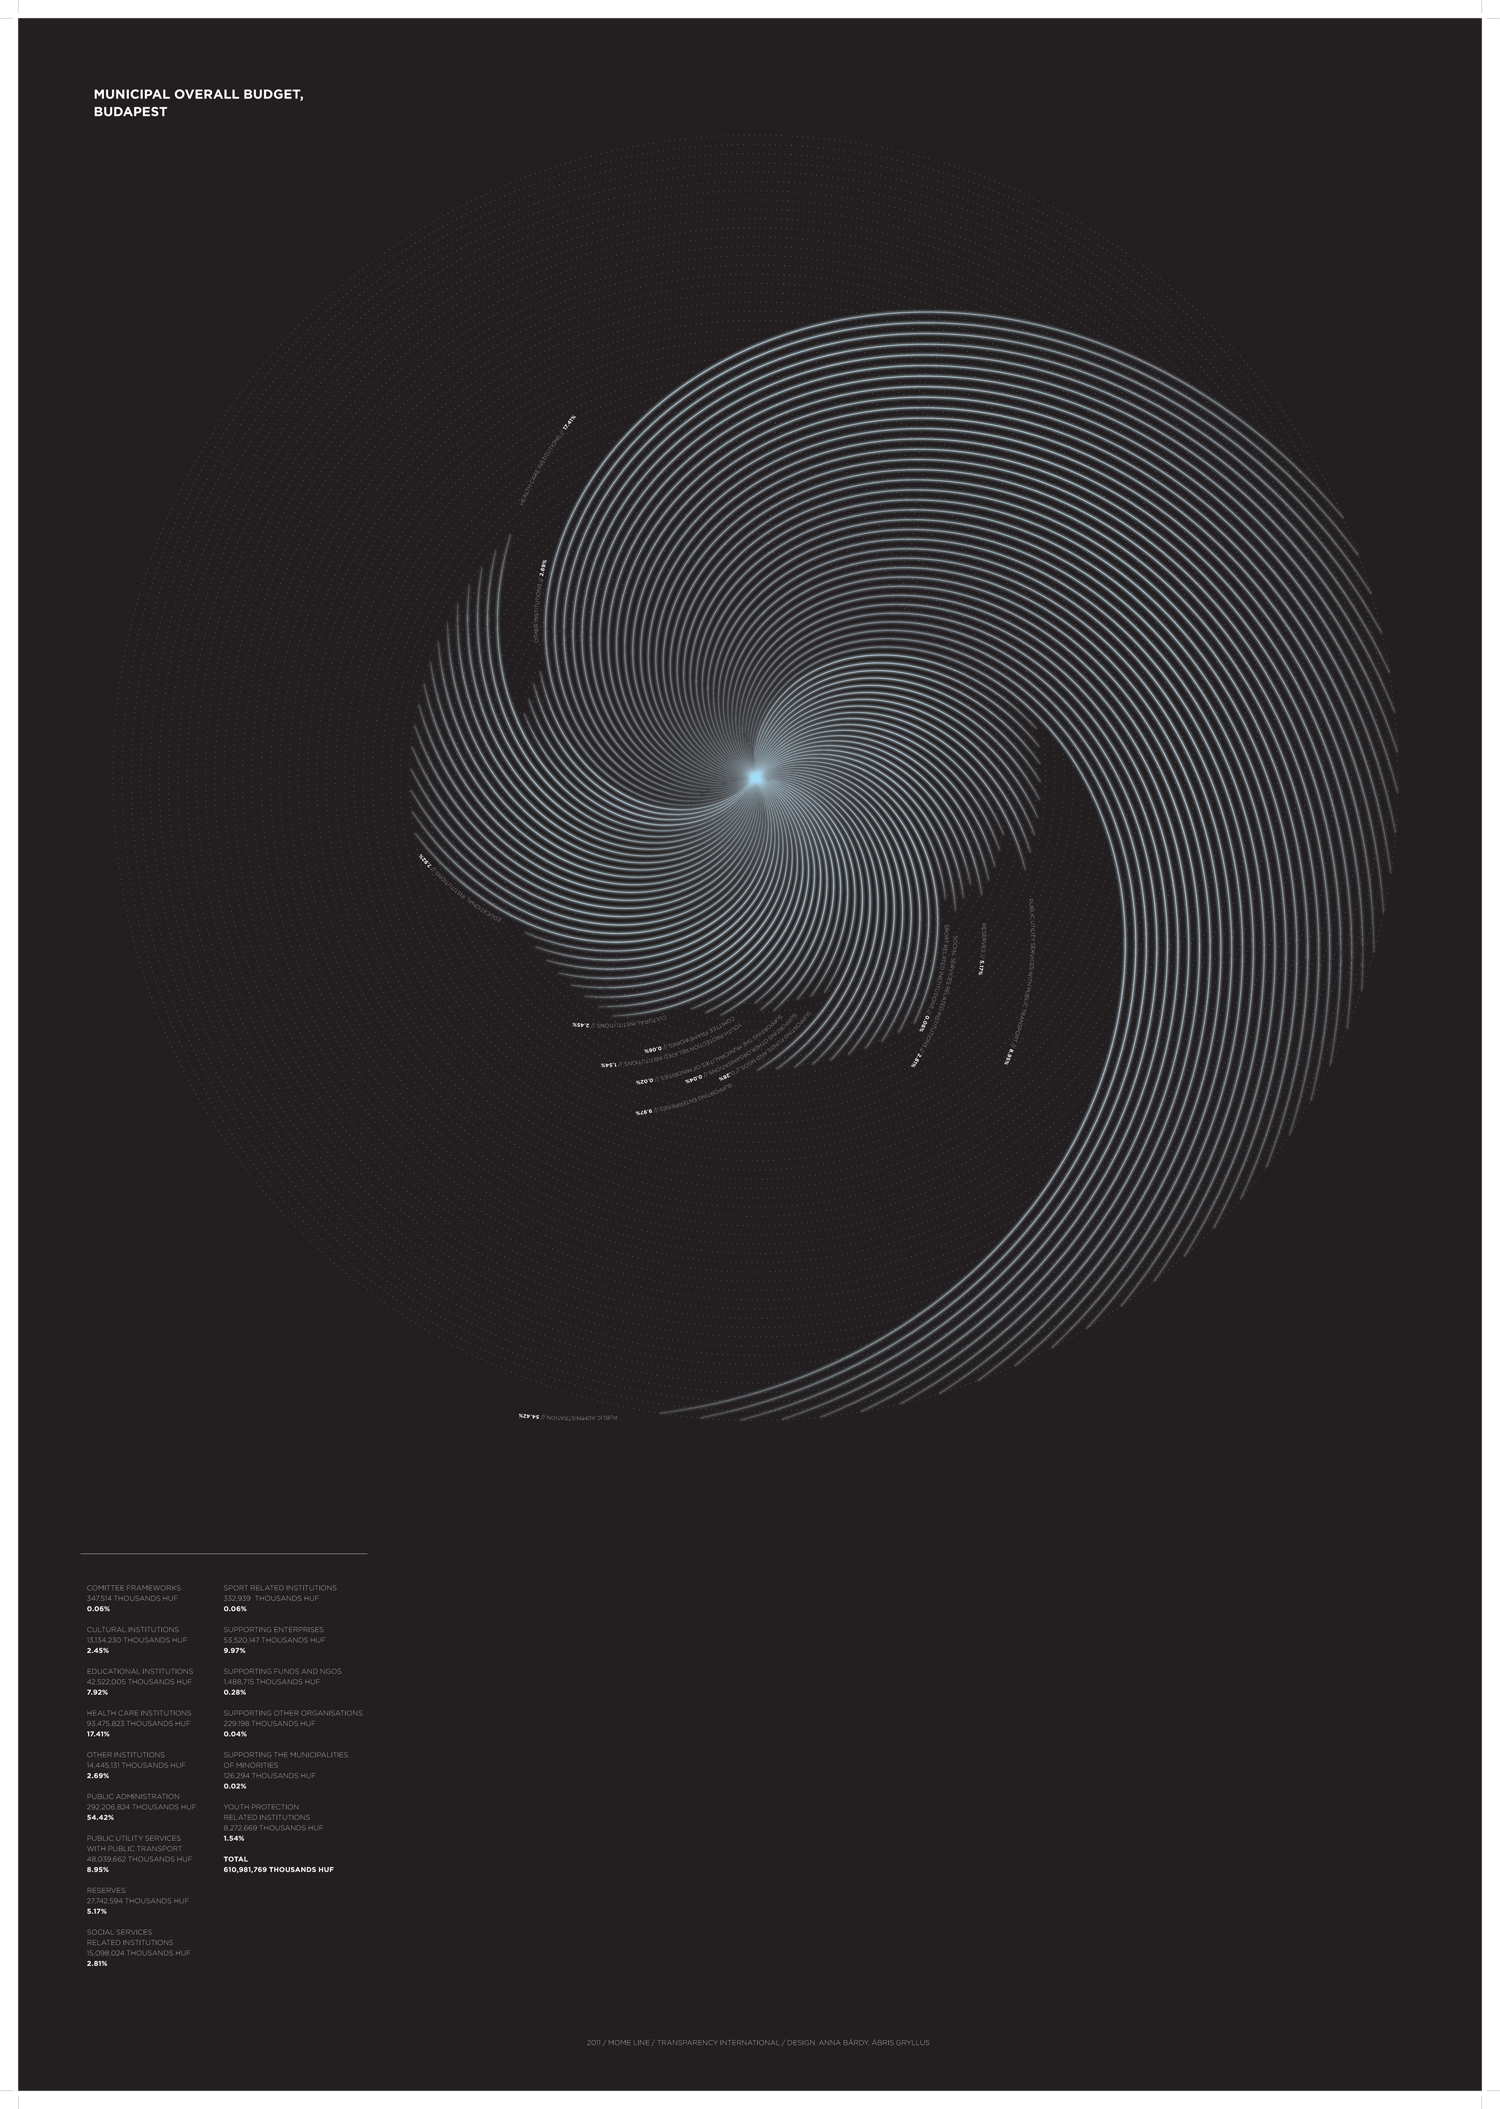
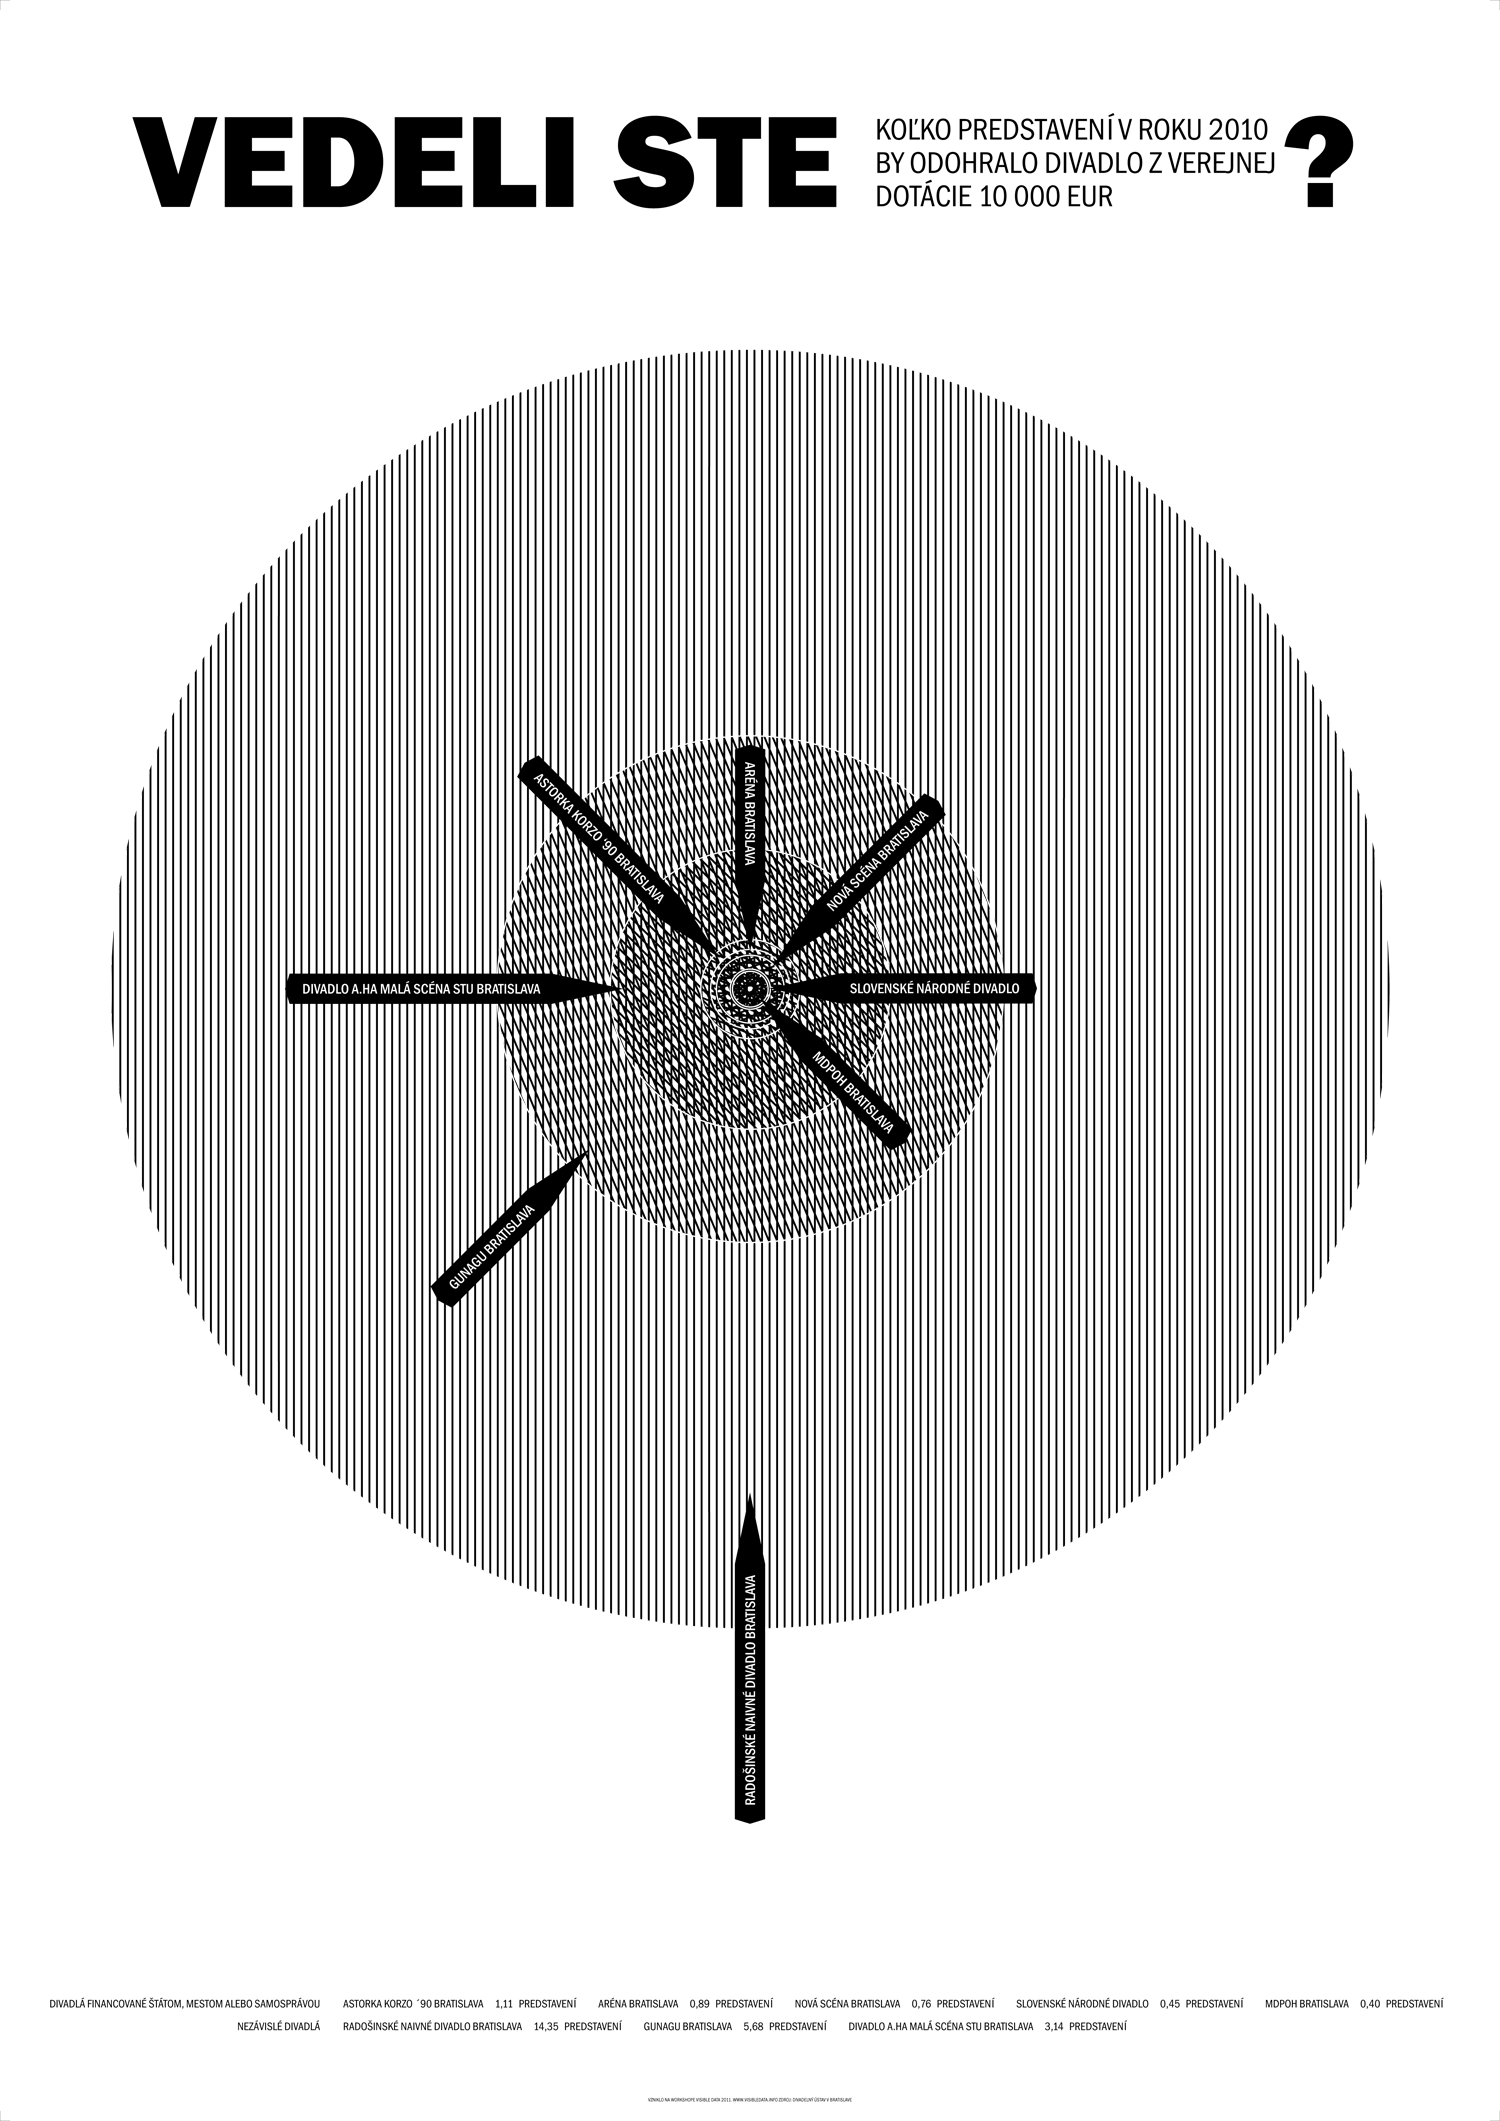
Antigravity spiral Municiapl Culture Budget of Budapest 2011 / This is more about visual than functional approach to data visualization. Clusters of lines indicate areas or institutions. Each cluster - by its width and length - represents a value between the lowest and highest percentage. The farther a cluster reaches from the middle and the more lines it is made up of (the wider it is), the higher the amount of money it gets. |
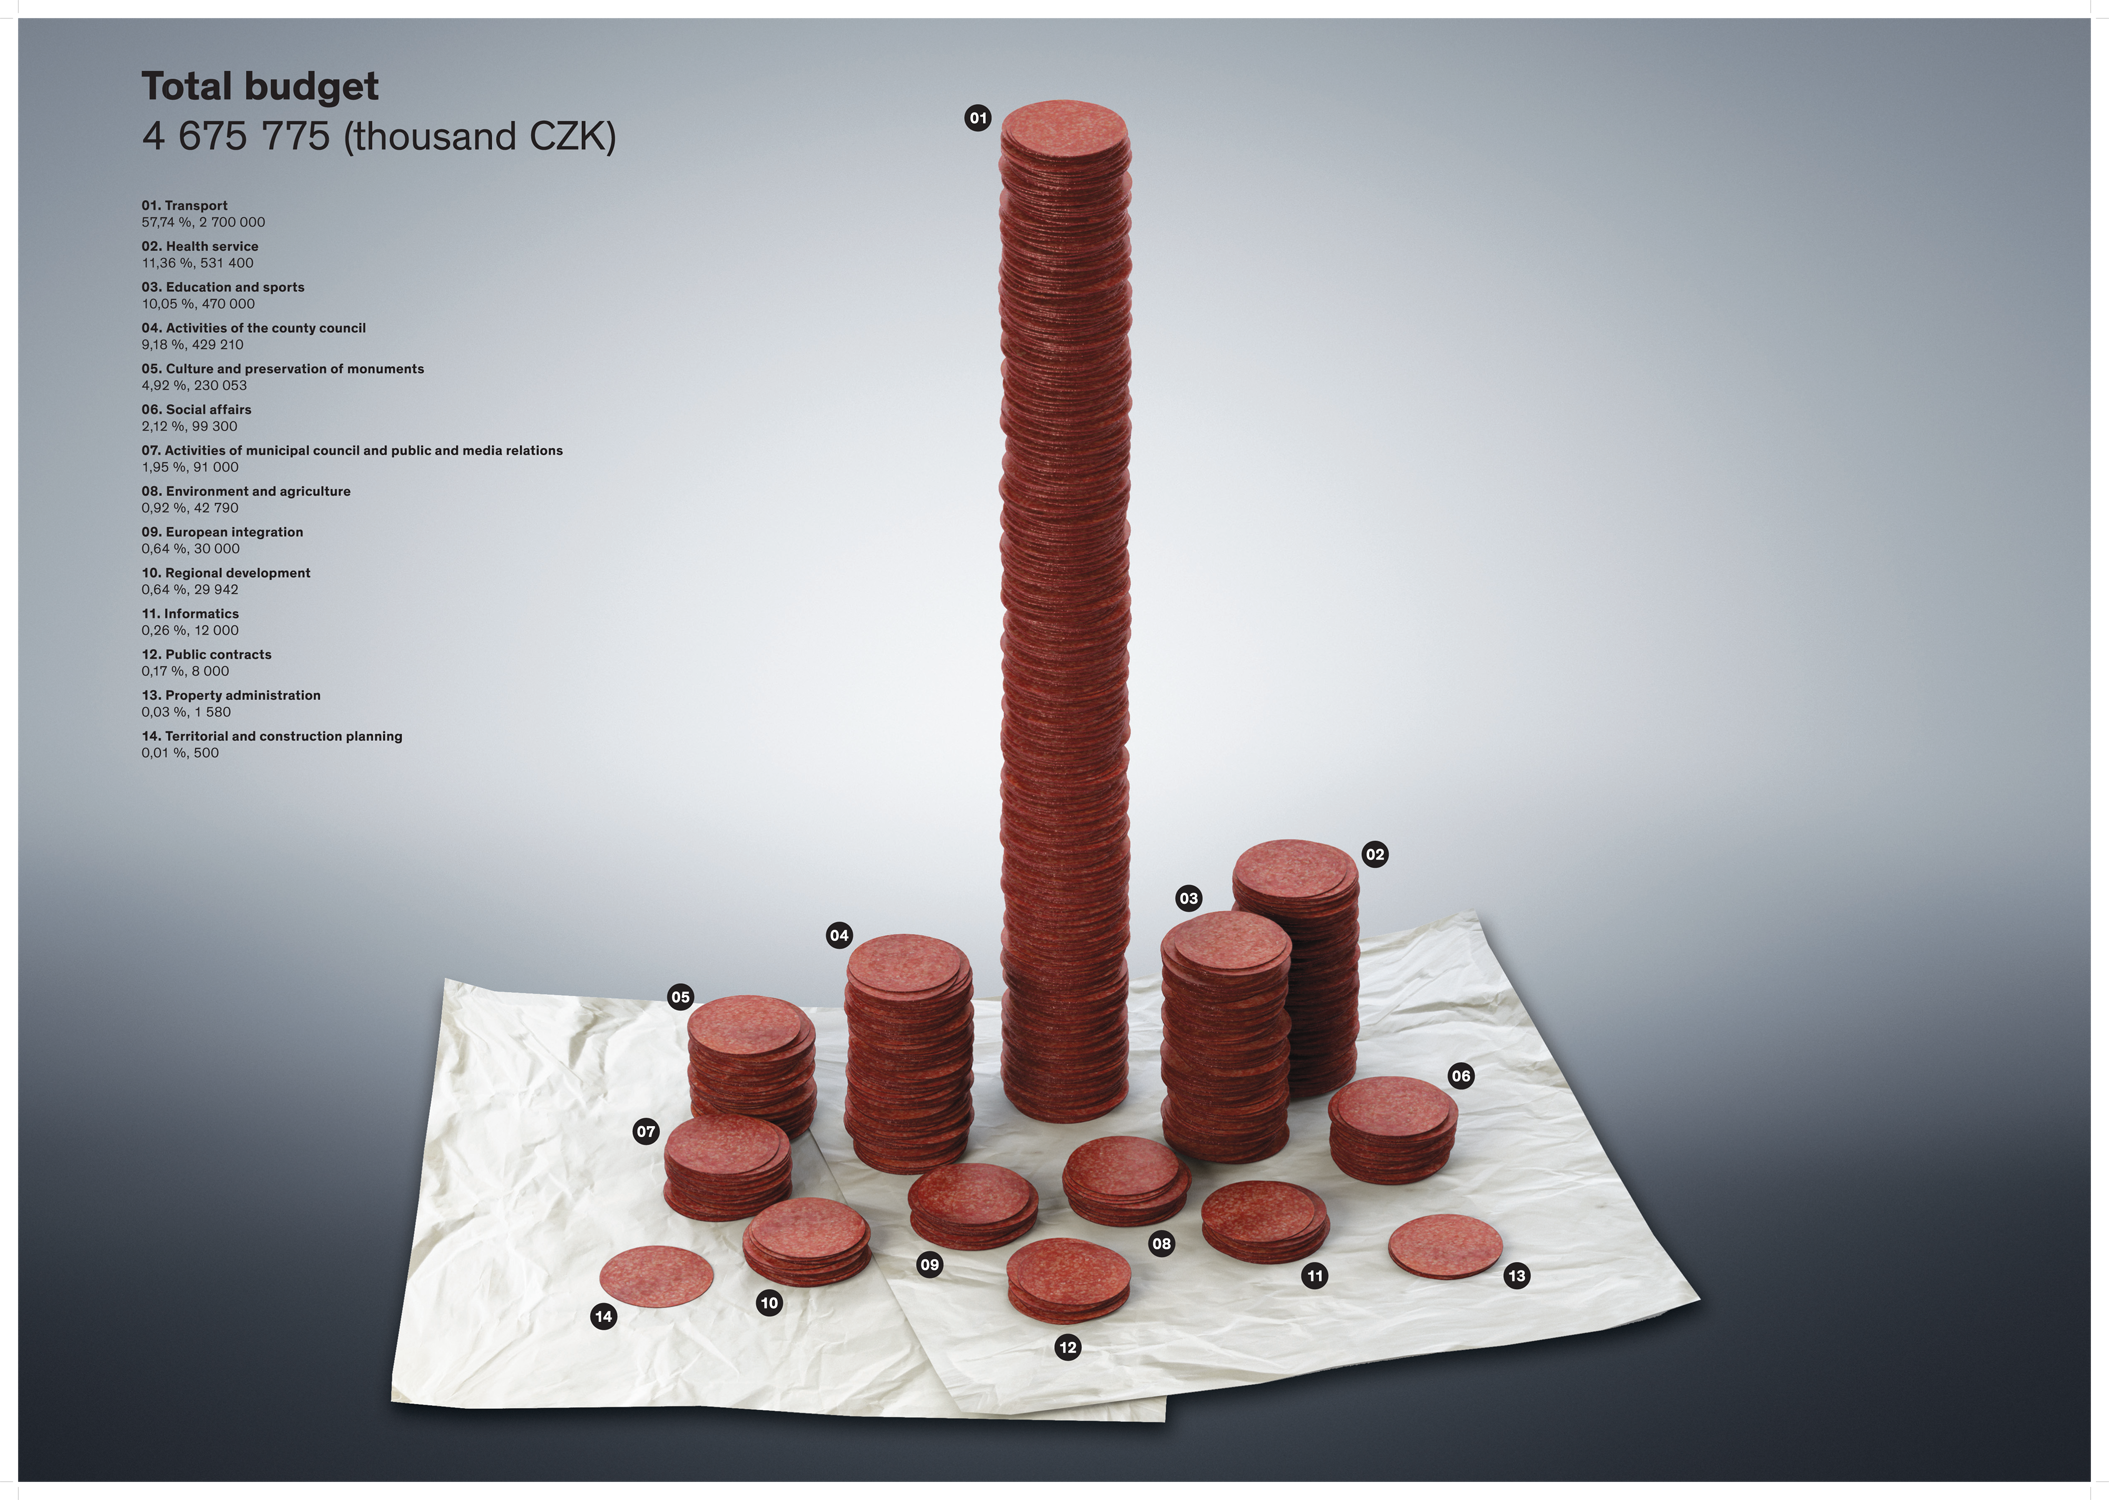
Czech Chart Regional Overall Budget of Central Bohemia Region 2011 / State institutions are fully or partly dependent from state and its financial support. Money from the state is to them like nutrition to a child. Some of them are well-fed, some are surfeited and some are underfed. Only the state decides about who will stay alive and full of energy as well as about who drops dead from malnutrition. Salami seems like the right food for the visualisation. Everybody knows it, can imagine its nutrition value and the Czechs like it. Salami is also linked to incrementalism - a method often used in politics - in Czech called "salami method". The political method typical for adding or taking away unnoticeably little by little instead of a few large jumps. Just like cutting off a stick of salami. |
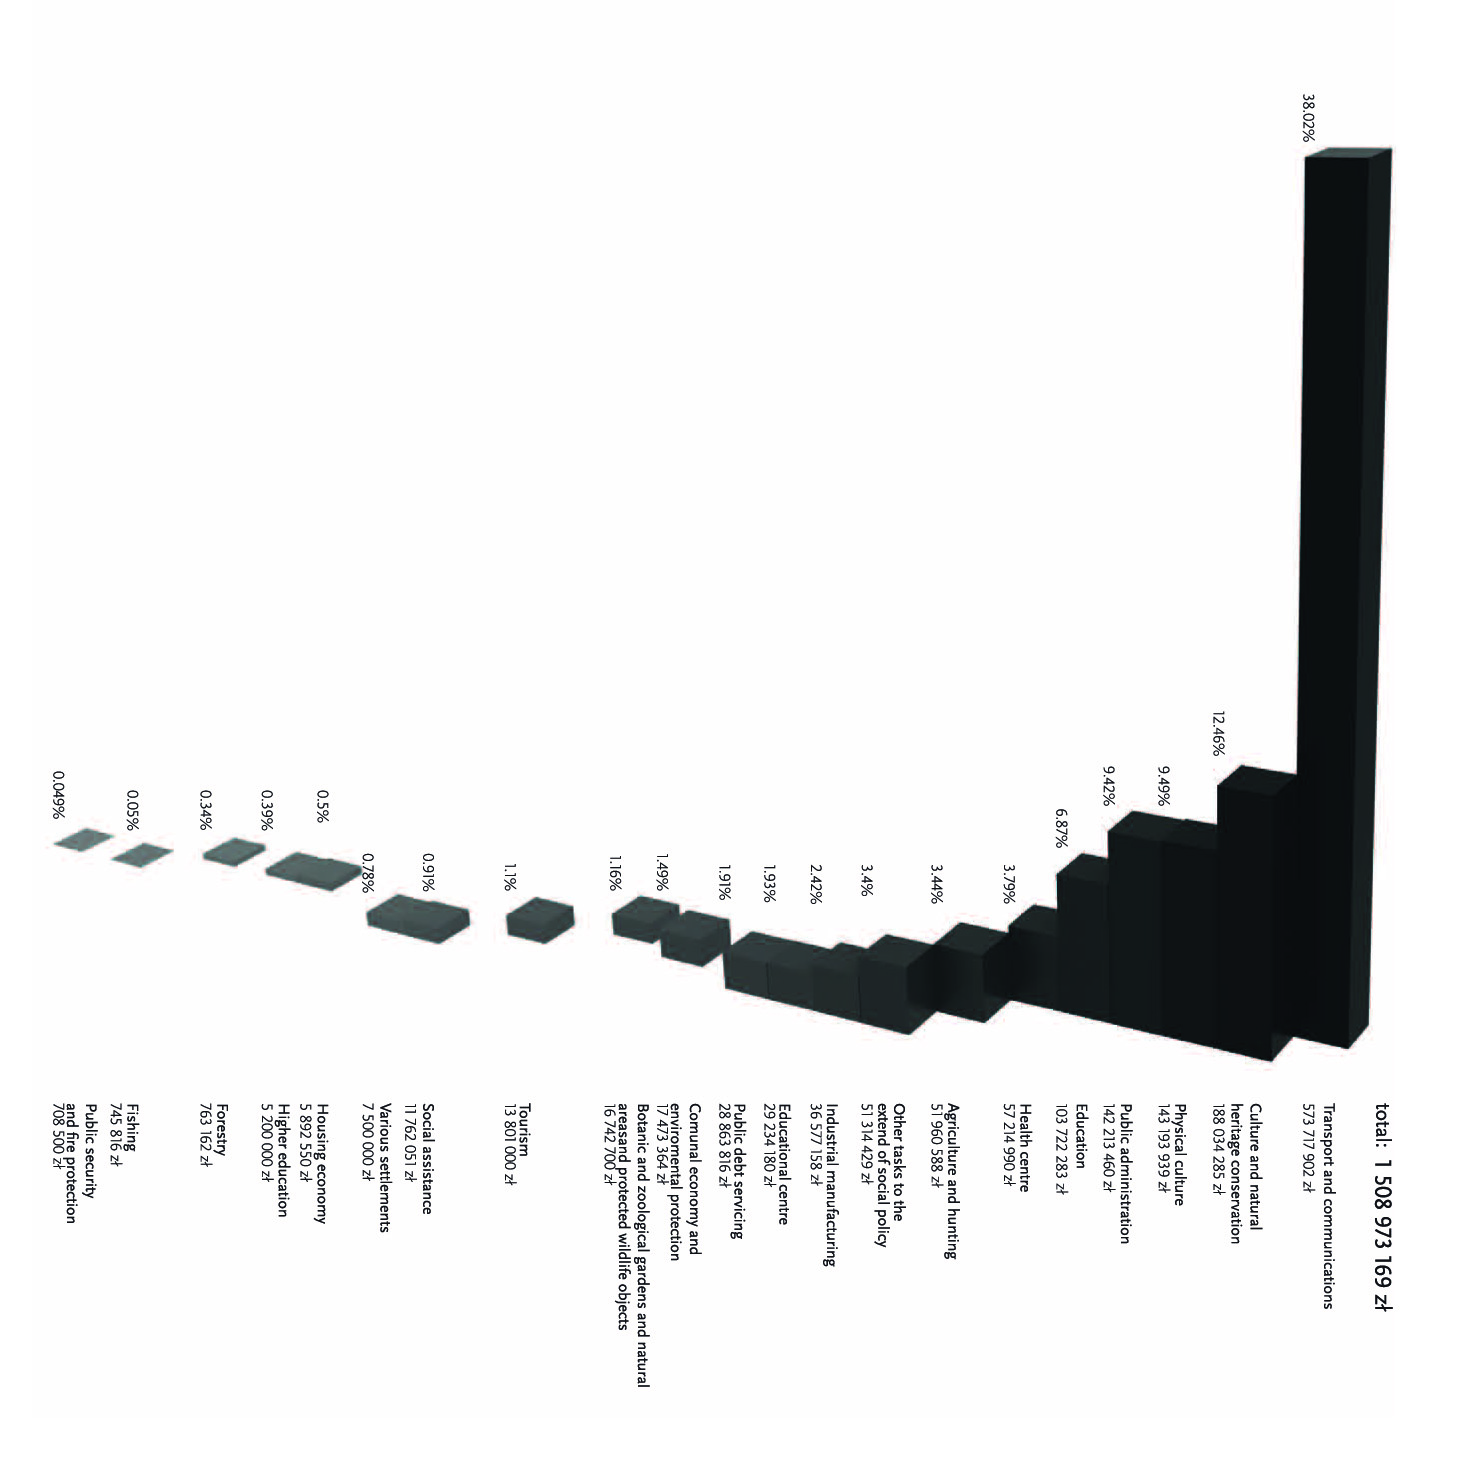
The City Regional Overall Budget of Silesia Regiona 2011 / The idea of this visualization is to show the budgets as a buildings in the city – the highest are located in the centre, the lowest are more like suburbs. The centre is usually the visiting card of the city and the suburbs are somewhere off the main attention of politicians – just like a last positions in the budgets. |

Balloons and Needles State Overall Budget of Hungary 2011 / The basis of this infographic is a concentric regular polygon with as many angles as many directions the fund goes. Starting from the smallest amount, from the inside of the structure, we render and connect various numbers of concentric shapes to each angle, depending on their percentage value. |

Fingerprint Municiapl Overall Budget of Katovice 2011 / Fingerprint is a basic identification of human being – it contains unique code of personality and data. It determines this data from the outside – just like the budget of a country determines its structure and contains basic information. Once perfectly shaped and it works always in a good way and for a good purpose. |
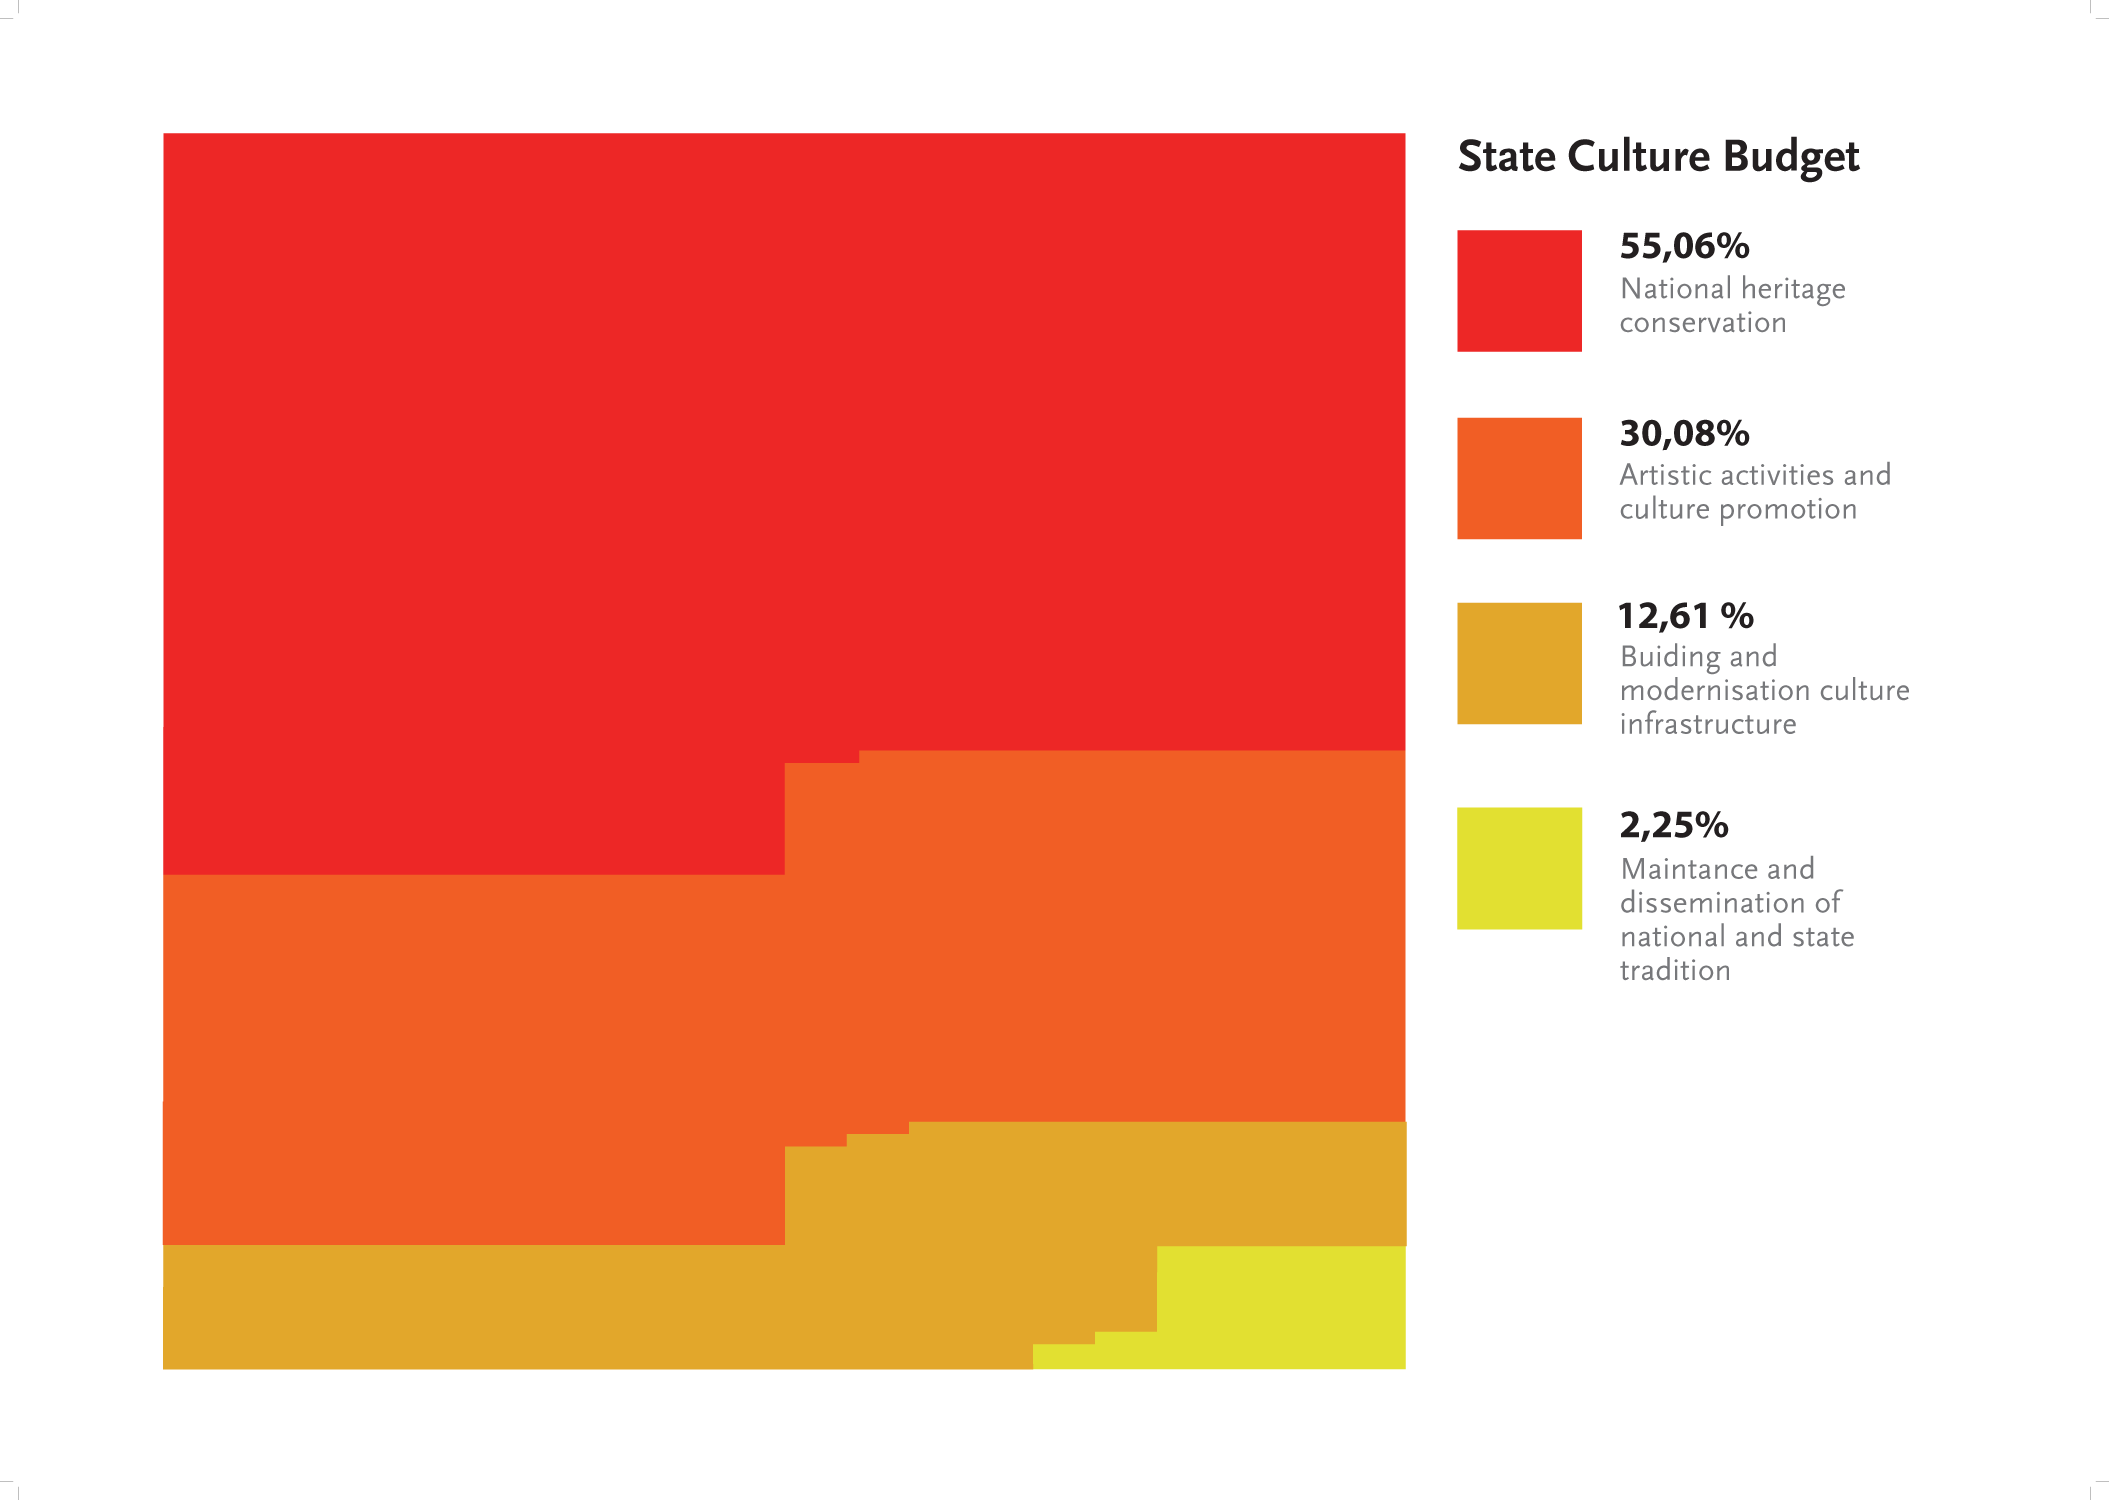
Pixel Budget State Culture Budget of Poland 2011 / Pixel-like visualization shows budgets in a colorful way – the bigger part is in red because this is the most warning Hue – and, similarly, the bigger part in a budget should be a special warning for the country. |
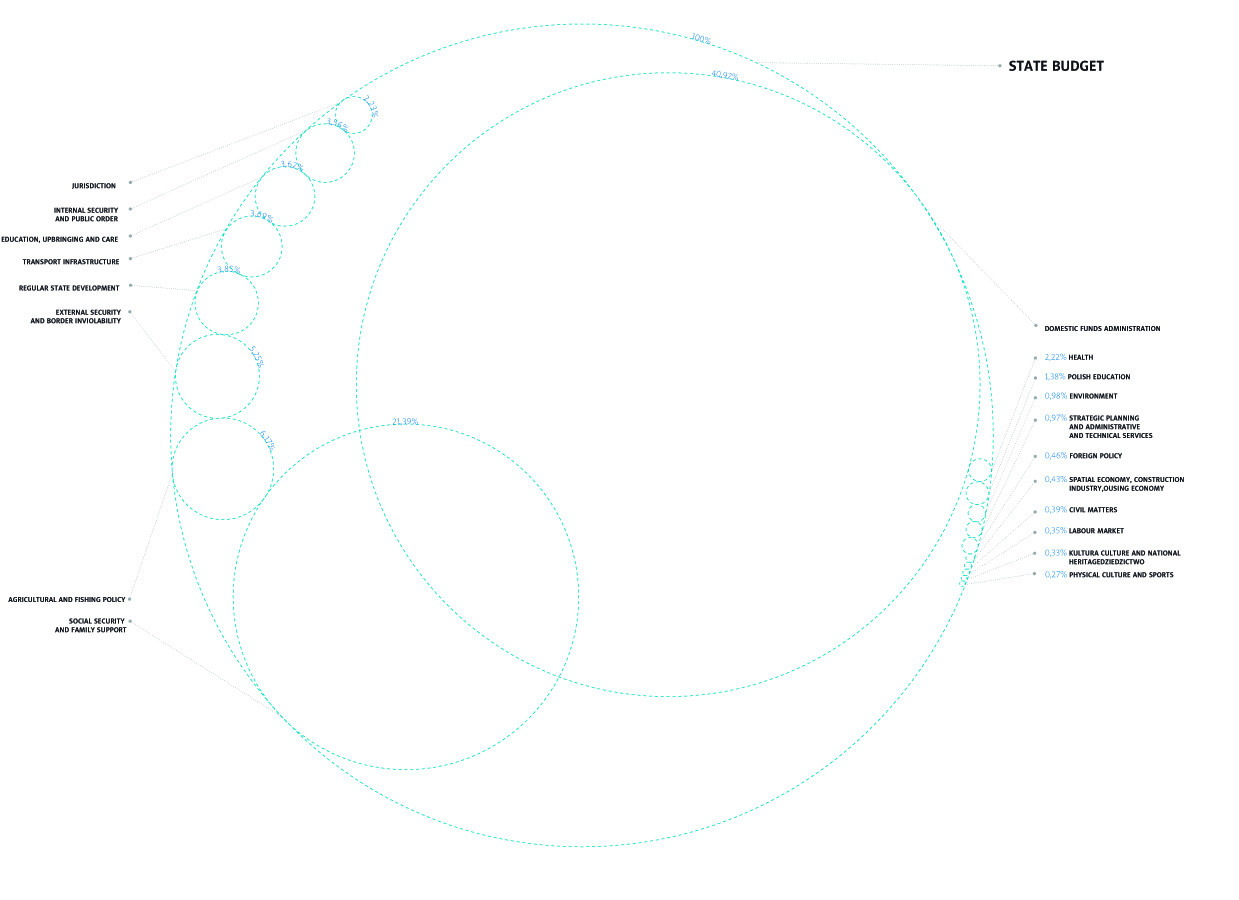
Eye Catcher State Overall Budget of Poland 2011 / An eye-shaped visualization is as simple as an optical lens – particular positions of a budget show where they are placed. It is very eye-catching. The budget is like the eye for the whole country. |
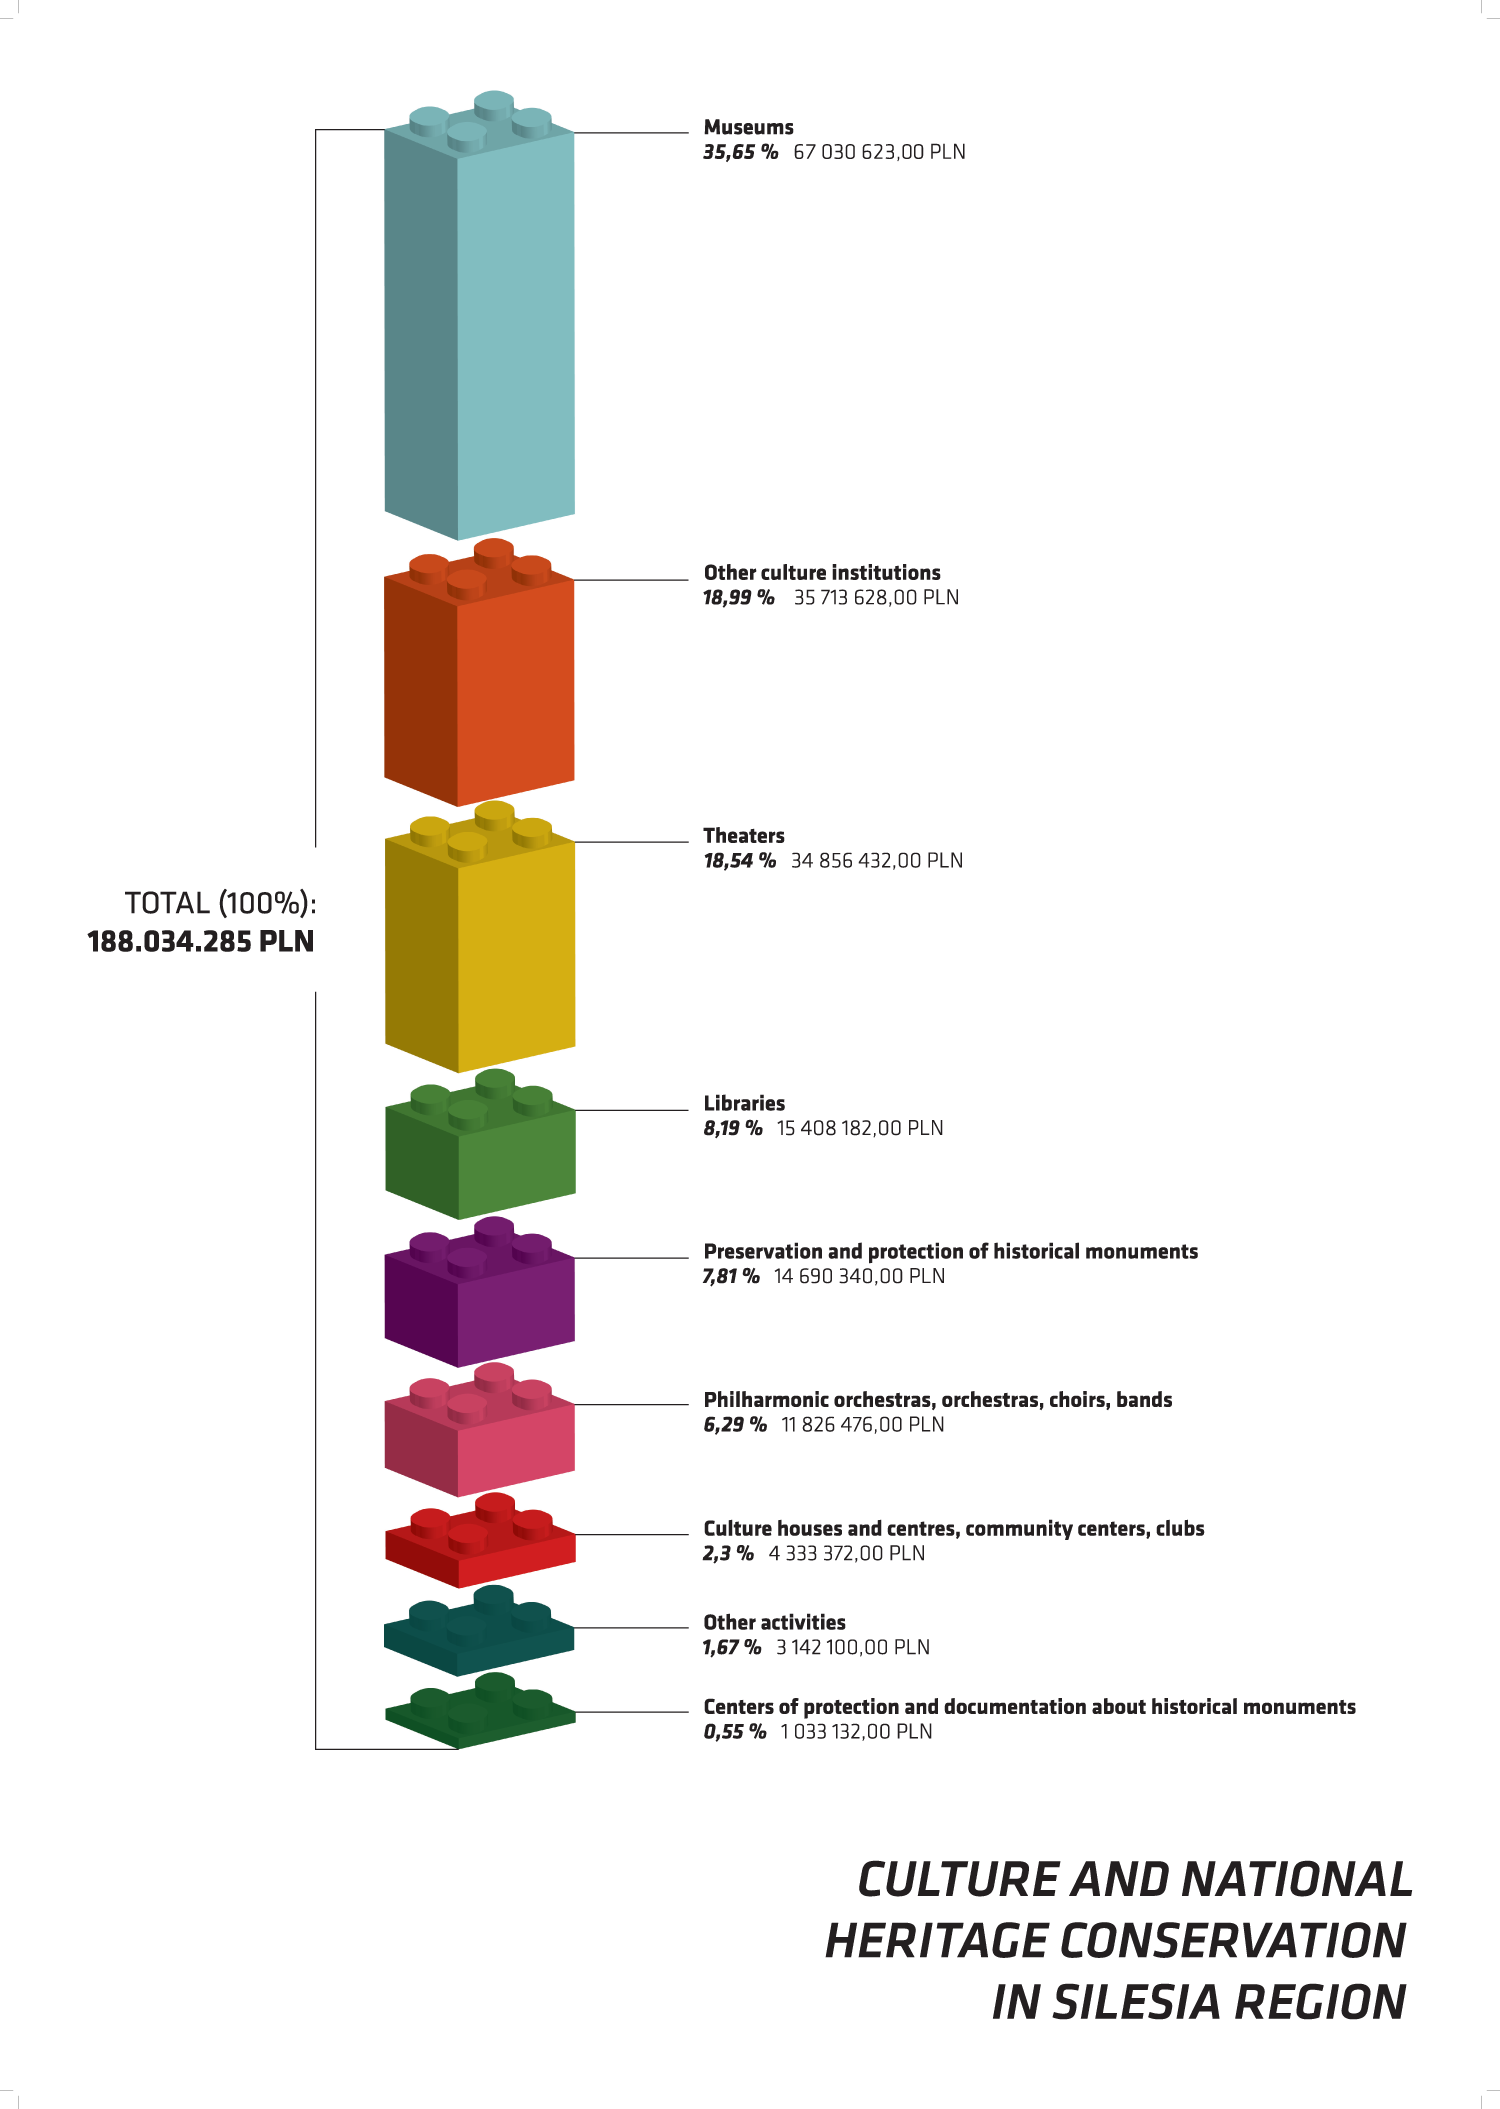
LEGO design Regional Culture Budget of Silesia Region 2011 / This budget visualization looks like a Lego blocks – they connect each other or they don´t. They are simple and colorful – if they work perfectly, the structure looks and works properly and useful, no matter what block you will put in – always matches. |
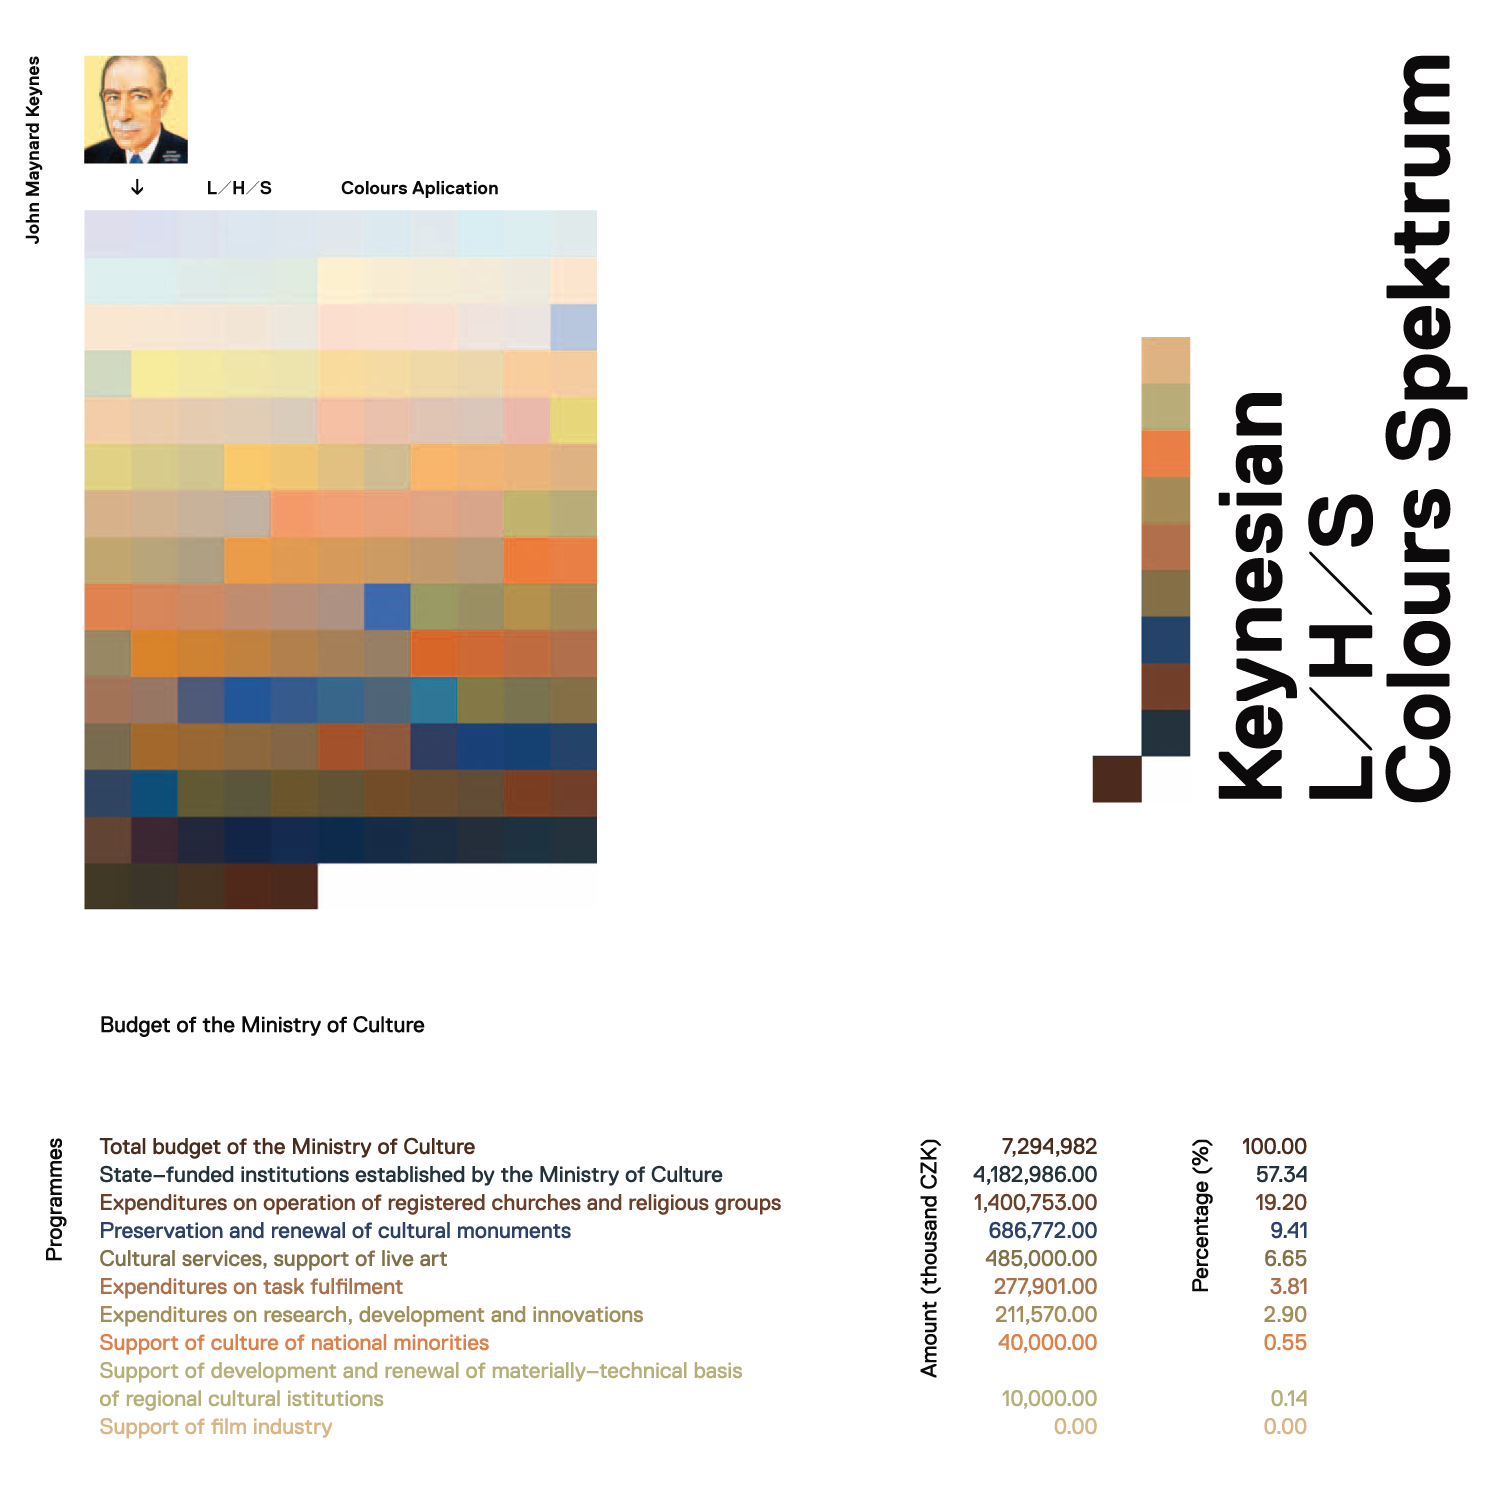
Keynes L/H/S. Regional Culture Budget of Central Bohemia Region 2011 / Work with hard data in the table brings us view of current budgeting, but the content of table is interpreted in different ways. The meaning of content is modified thanks a number of attitudes that represent political or economical background of interpret. Whenever we show the table to ten different economists with different approaches to fiscal policy, we receive ten different stories. We have used a specially created application that dispenses a picture into particular colours appearing in the picture. In this application, the LHS system is intently disposed. Thanks to this system, a colour field arises that is ranked in accordance with brightness of colours. Every part of the spectrum indicates a colourfulness of individual row in the table. As an original picture, a portrait of John Maynard Keynes - the main representative of modern economy in the 21th century is utilized. His ideas helped to overcome the economic crisis in the 30’s. |

Culture limited State Overall Budget of Republic of Serbia 2011 / Main motive is strong claim that is also a typographical graph. Each letter represents one minis try of Czech Republic Government. Simple visualization enables rapid orientation in the displayed data. It speaks for itself and the Ministry of Culture and accent color is for illustrative communication. |
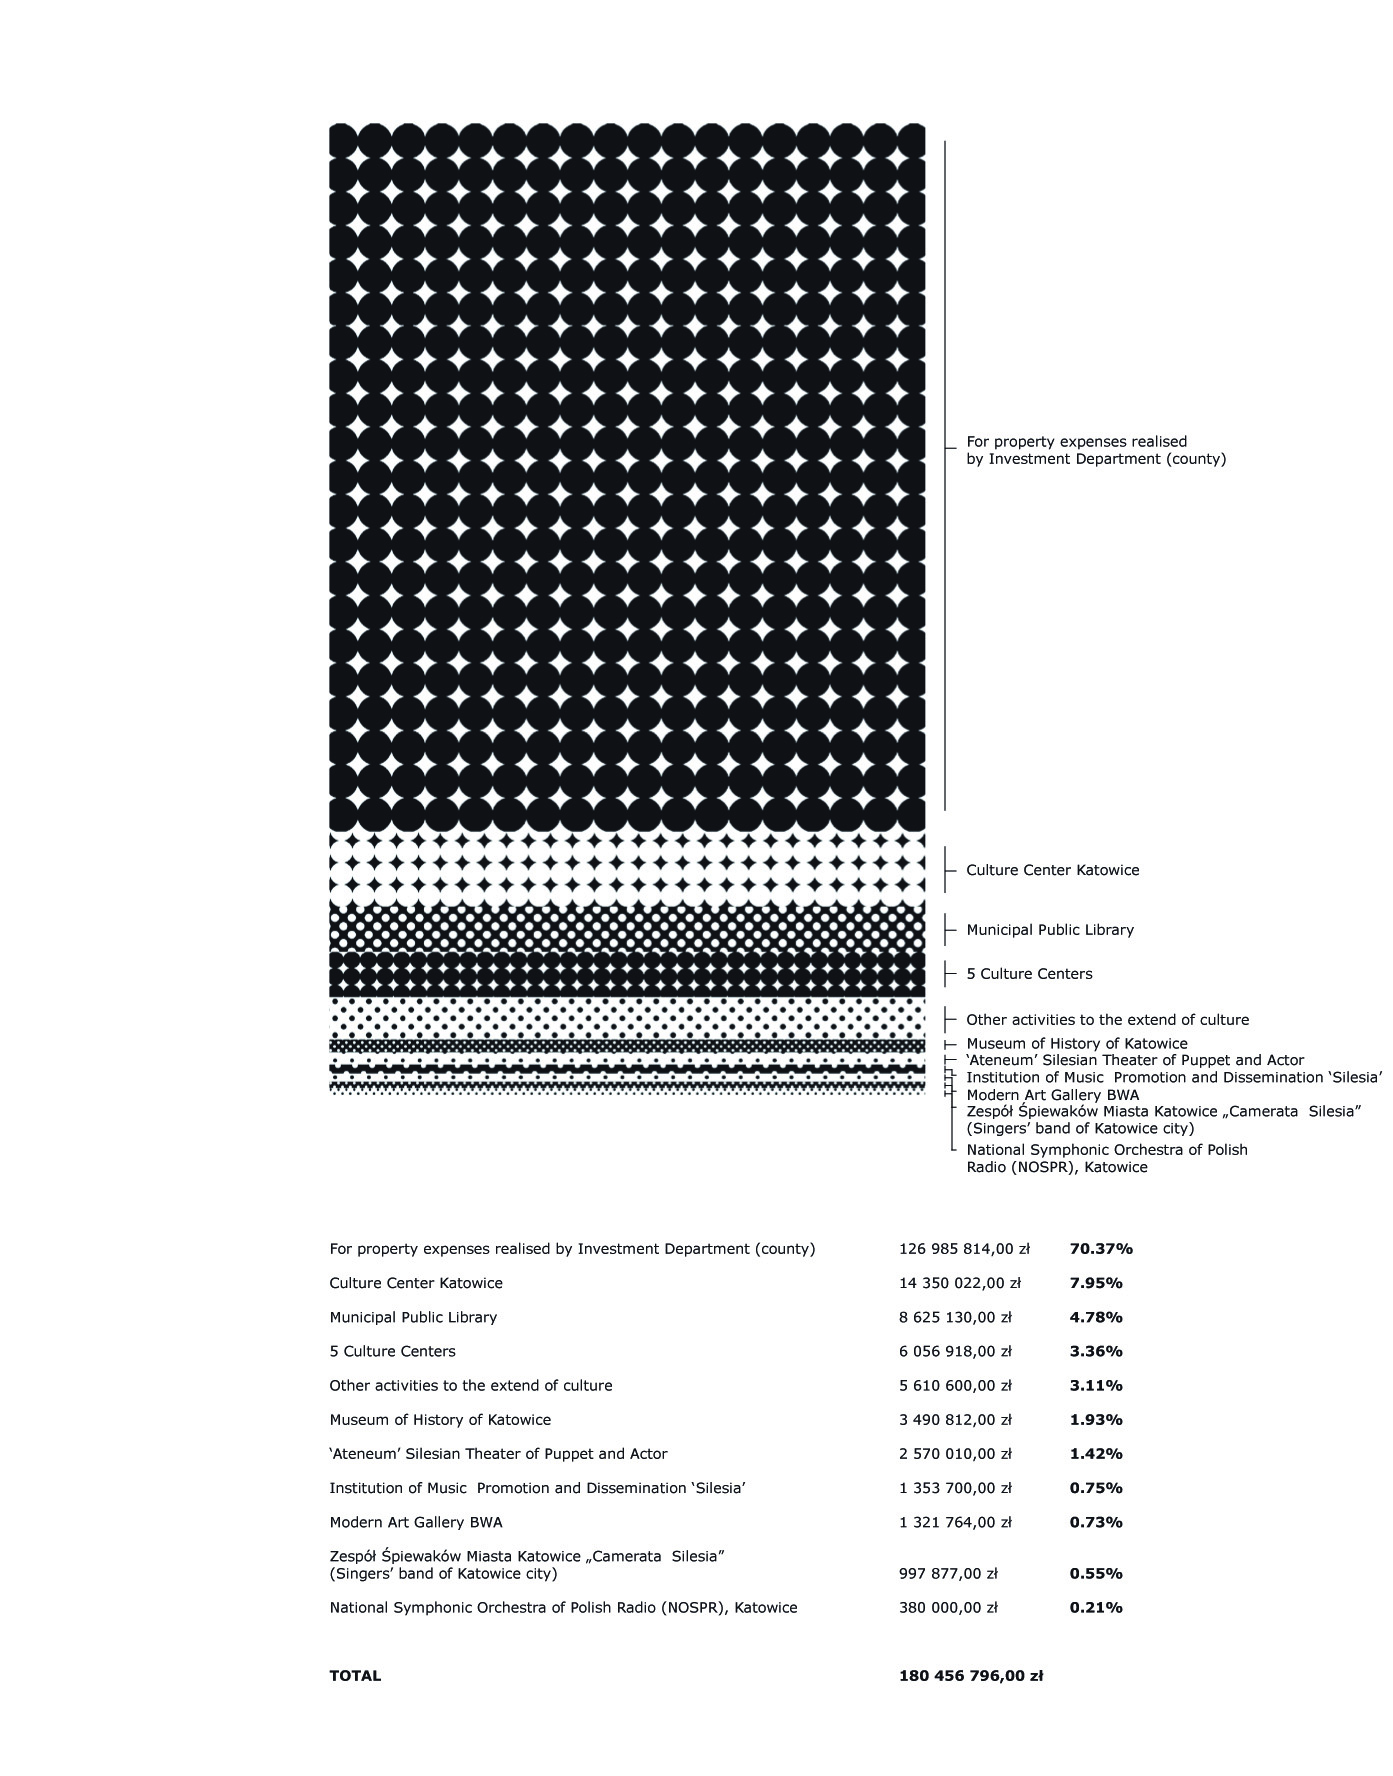
Budget decks Municipal Culture Budget 2011 of Katowice / This visualization uses a graphic raster which symbolize budget decks – every good analysis and structure need proper base, history, downs and surface. Sometimes, it needs a lot of time to be in a proper shape, however, a good quality and proportions of this structure guarantee good prosperity. |
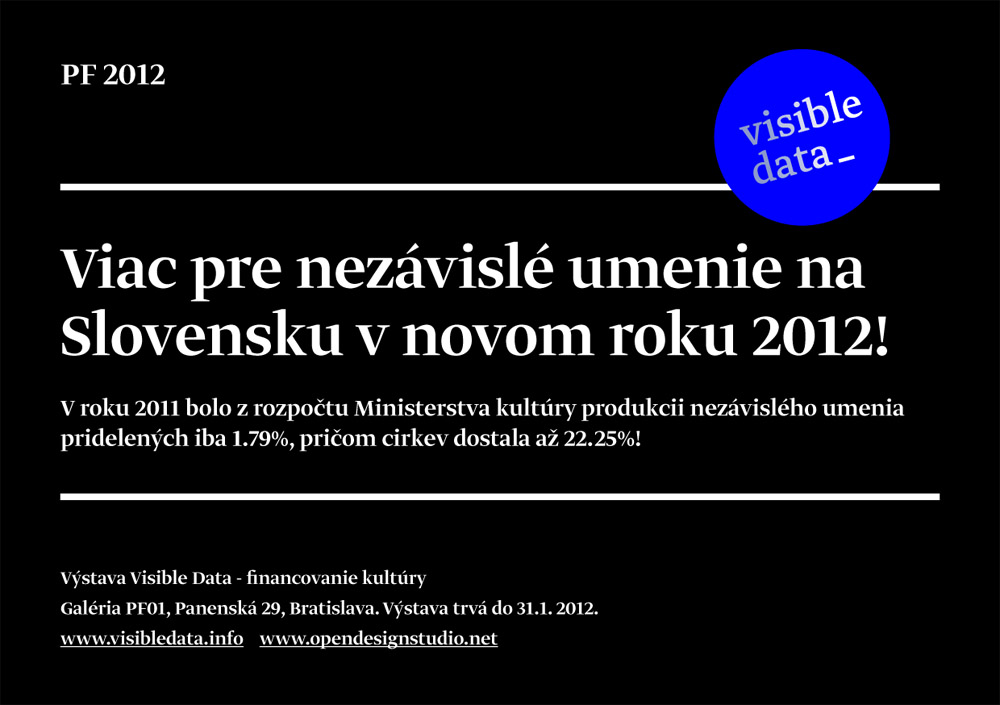
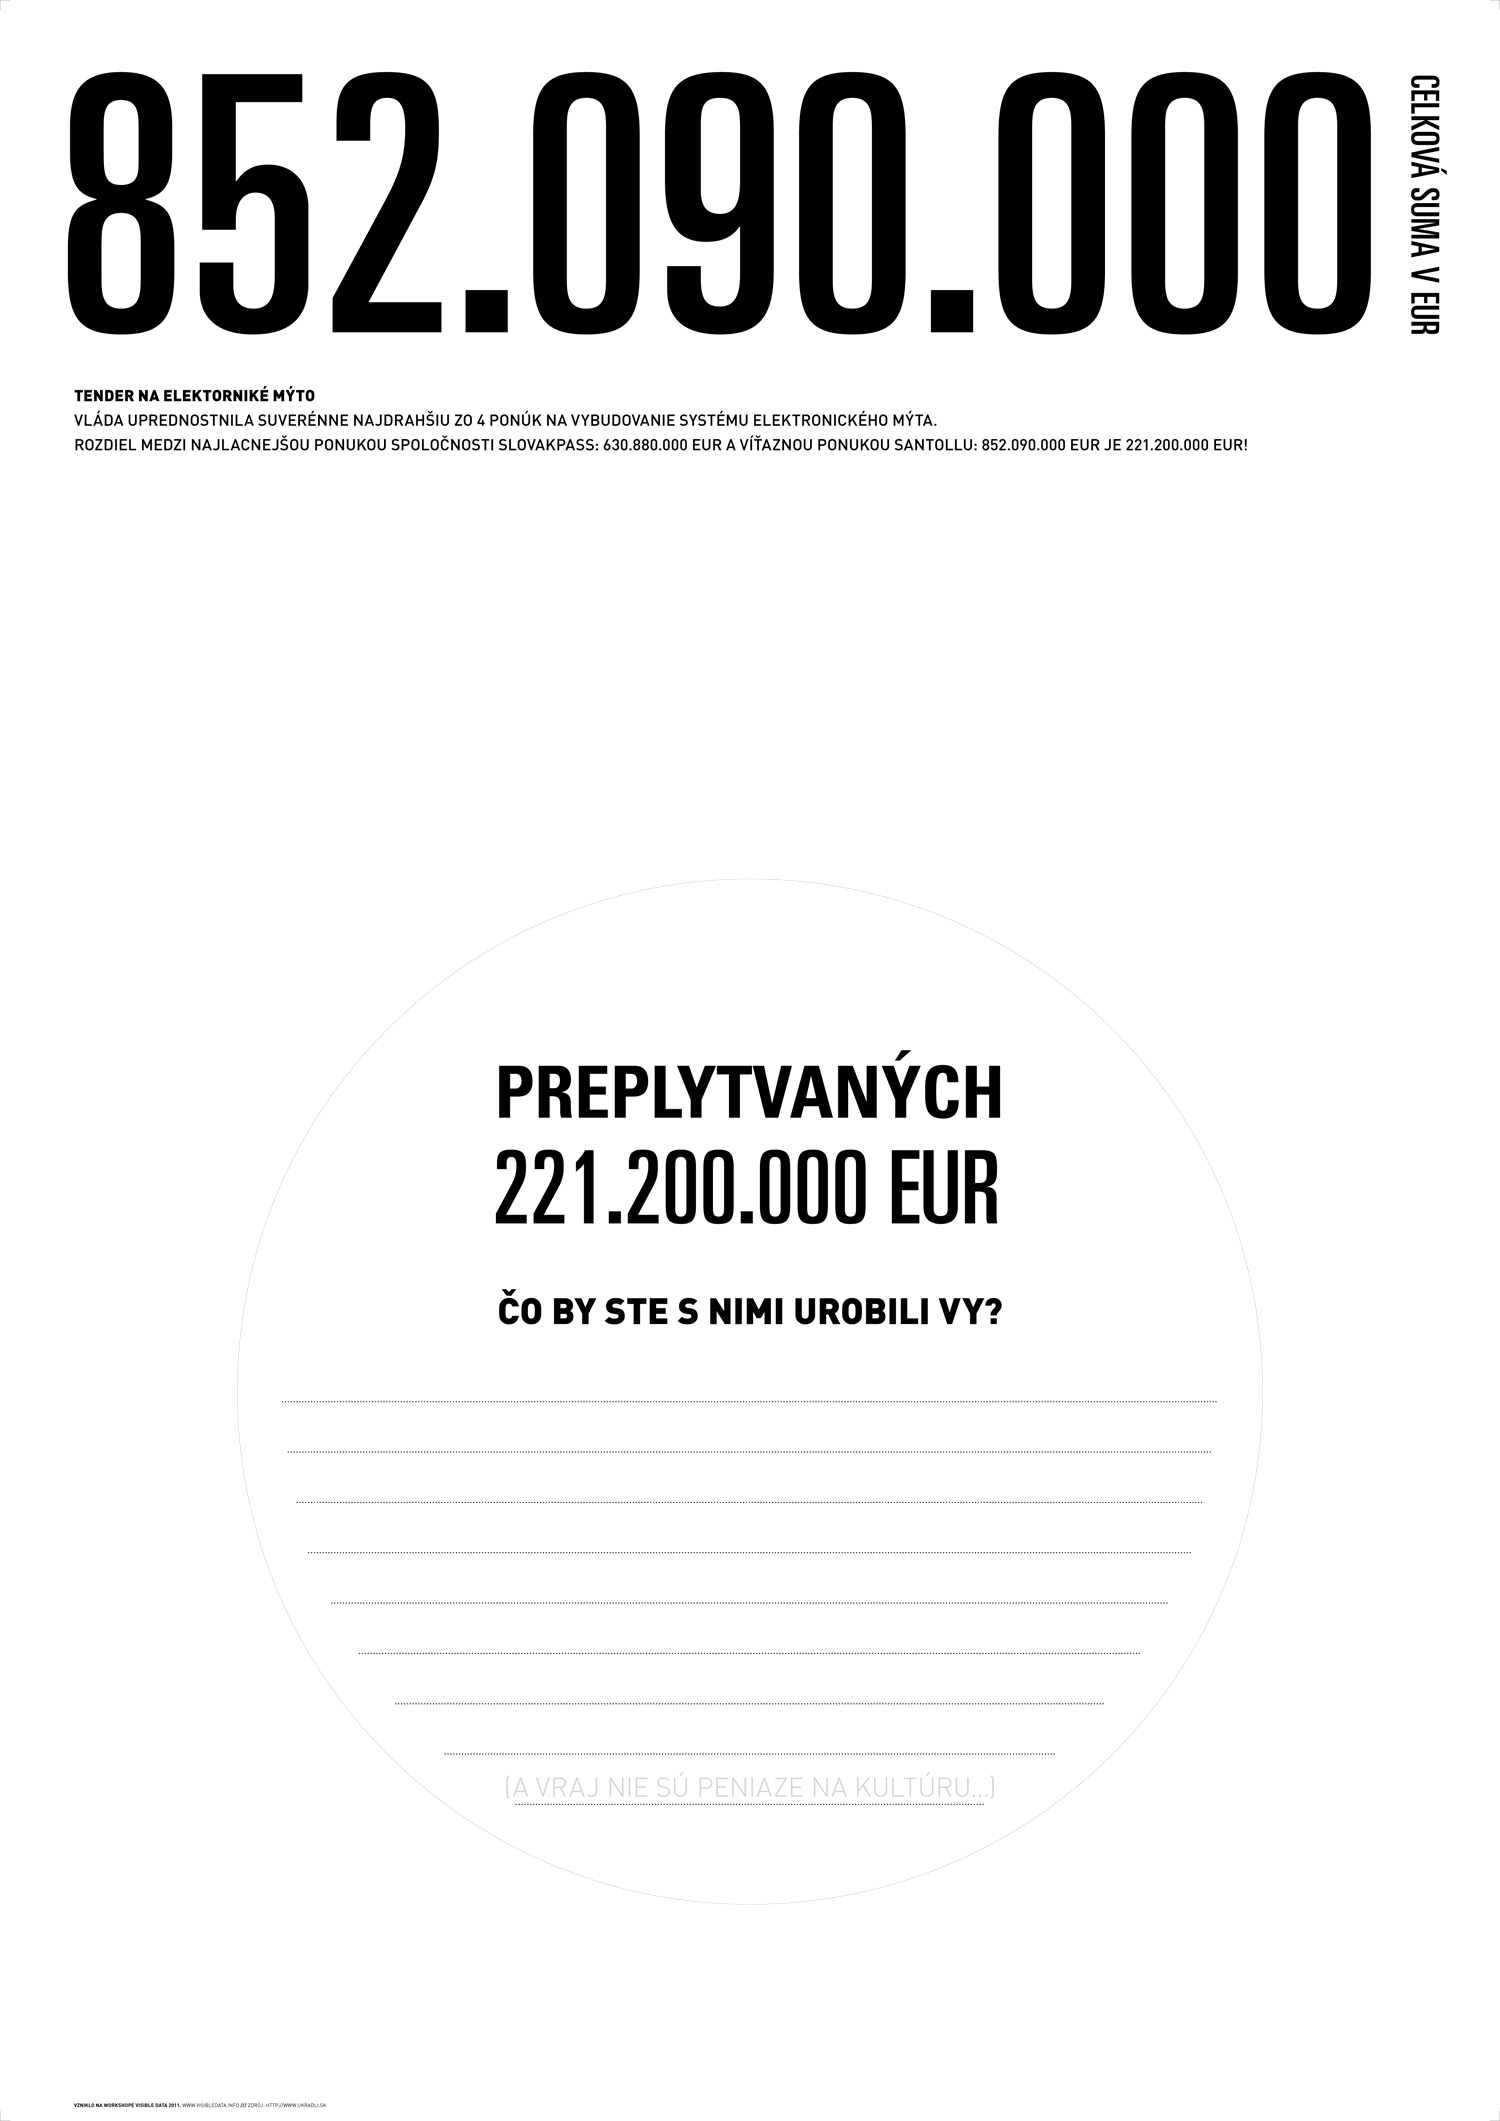
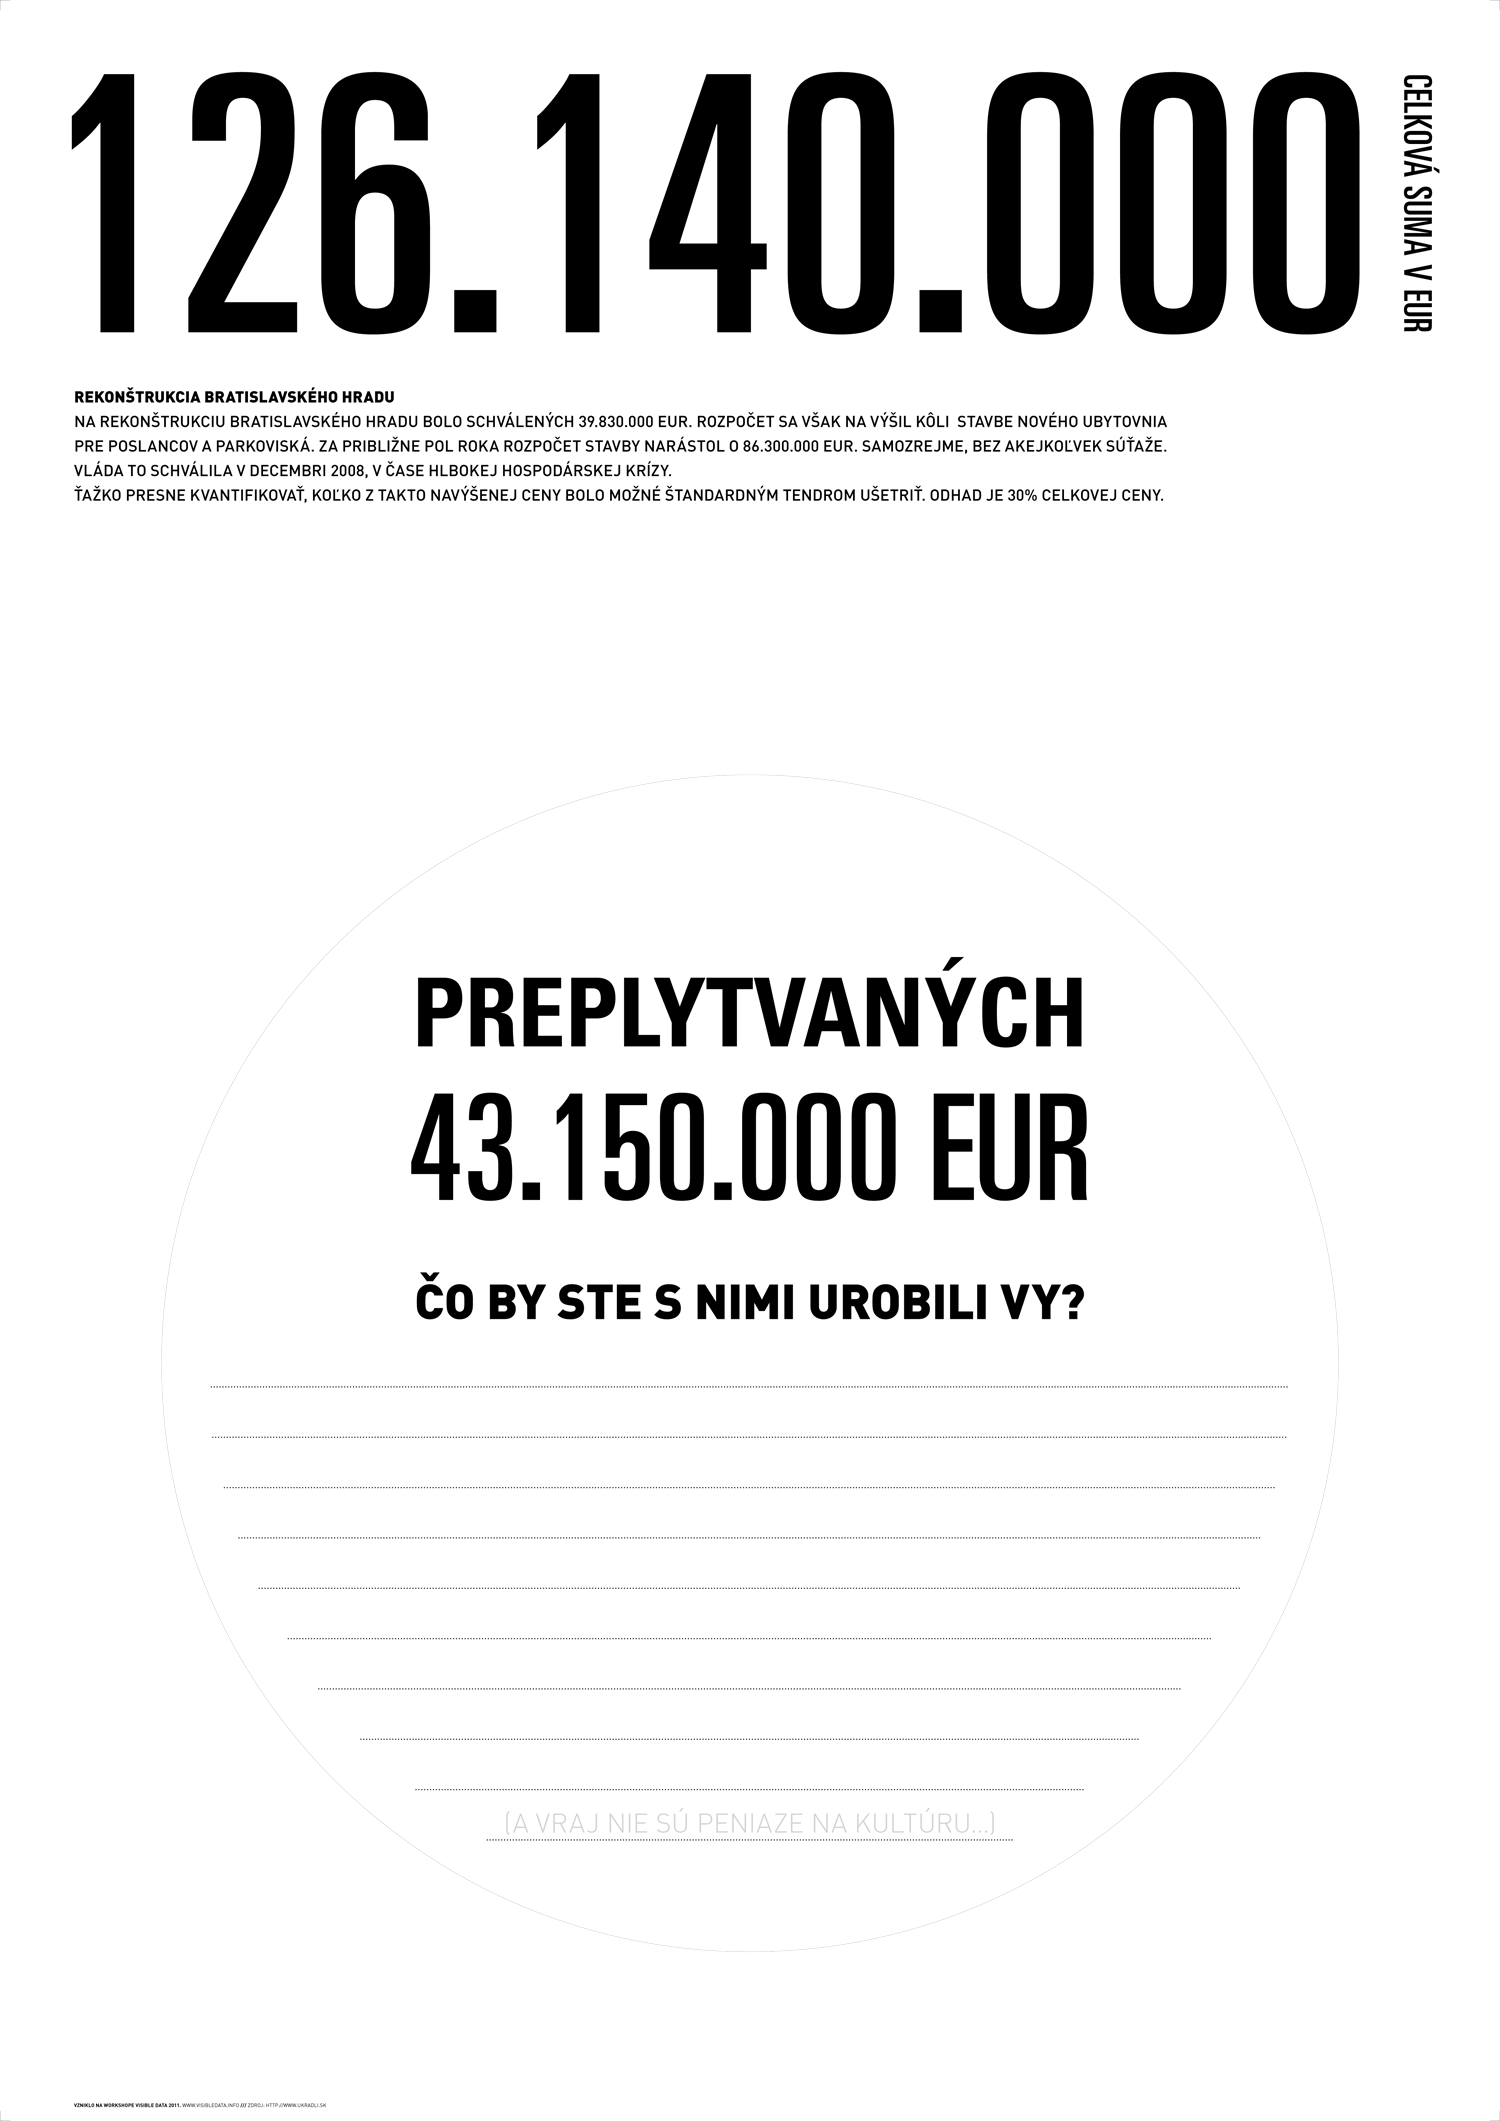
PF cards in e-mail versions with little provocative content were adressed to all Bratislava City and Bratislava Self-governing Region politicians, council members and magistrates and all members of National Council of Slovak Republic. They looked like typical New Years wish, instead of traditional wish, there was wish for better financing of culture argumented with real facts as numbers and persentages. PF cards were visually connected with the Visible data projection and contained the same data and information about the local and national problems in financing culture in Slovakia. In order to communicate these problems within cultural public PF cards as images were posted also on Facebook to use this most-common contemporary medium.” |